Introducción a la visualización de datos en Excel
Visualización de datos en Excel

Agata Bak-Geerinck
Senior Data Analyst, Telenet
Excel: la herramienta de análisis de datos más versátil

- La herramienta de análisis de datos favorita del mundo$^1$.
- Flexible y versátil gracias a las celdas.
- También puede visualizar datos.
- Primer paso hacia otras herramientas de visualización (Tableau / Power BI)
1 https://www.computerworld.com/article/3315737/use-microsoft-excel-to-learn-about-data-analytics.html
¿Qué es la visualización de datos?
- Representación gráfica de información
- Comunicación de datos (complejos) a audiencias amplias
- Elección de los gráficos y elementos visuales más adecuados
El poder de visualizar tus datos


1 https://elearningindustry.com/visual-learning-6-reasons-visuals-powerful-aspect-elearning
¿Qué veremos en este curso?
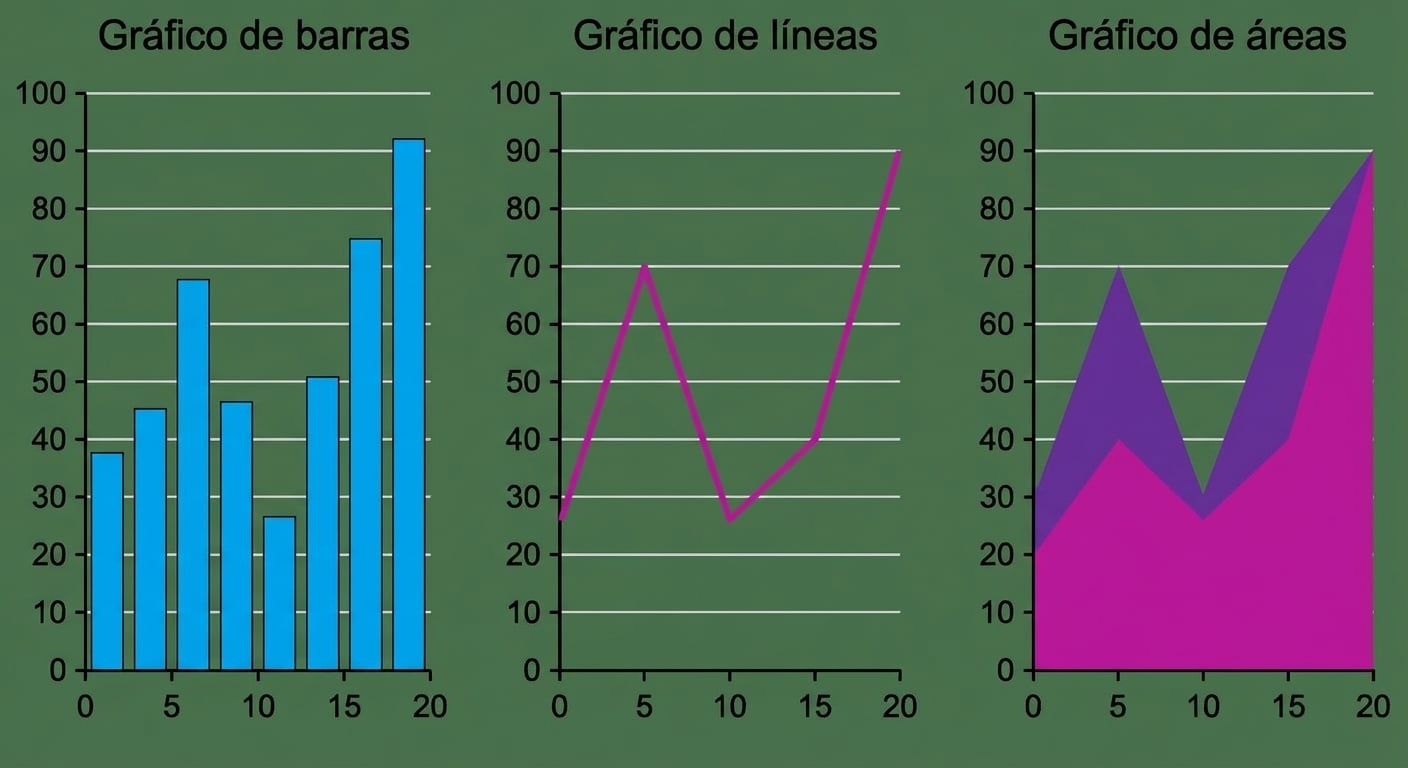
Gráficos básicos
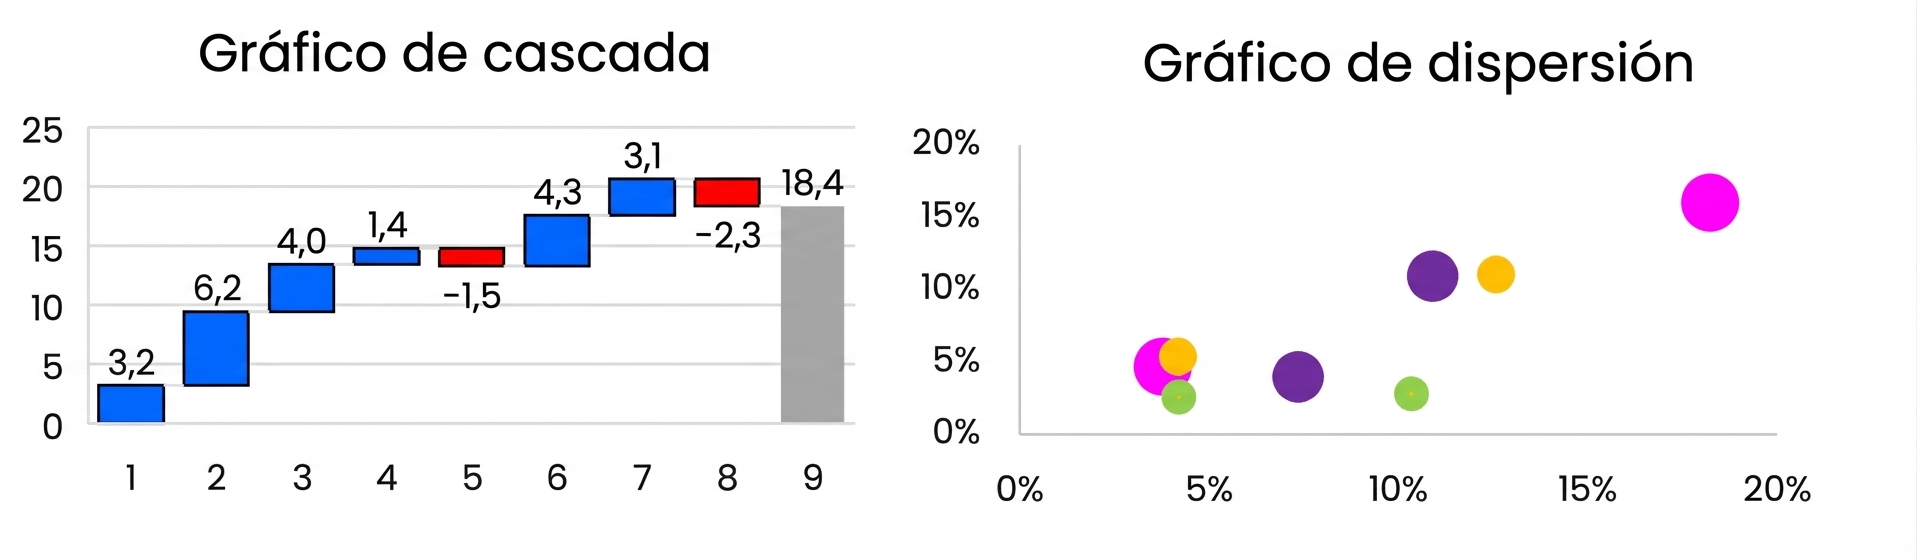
Gráficos avanzados
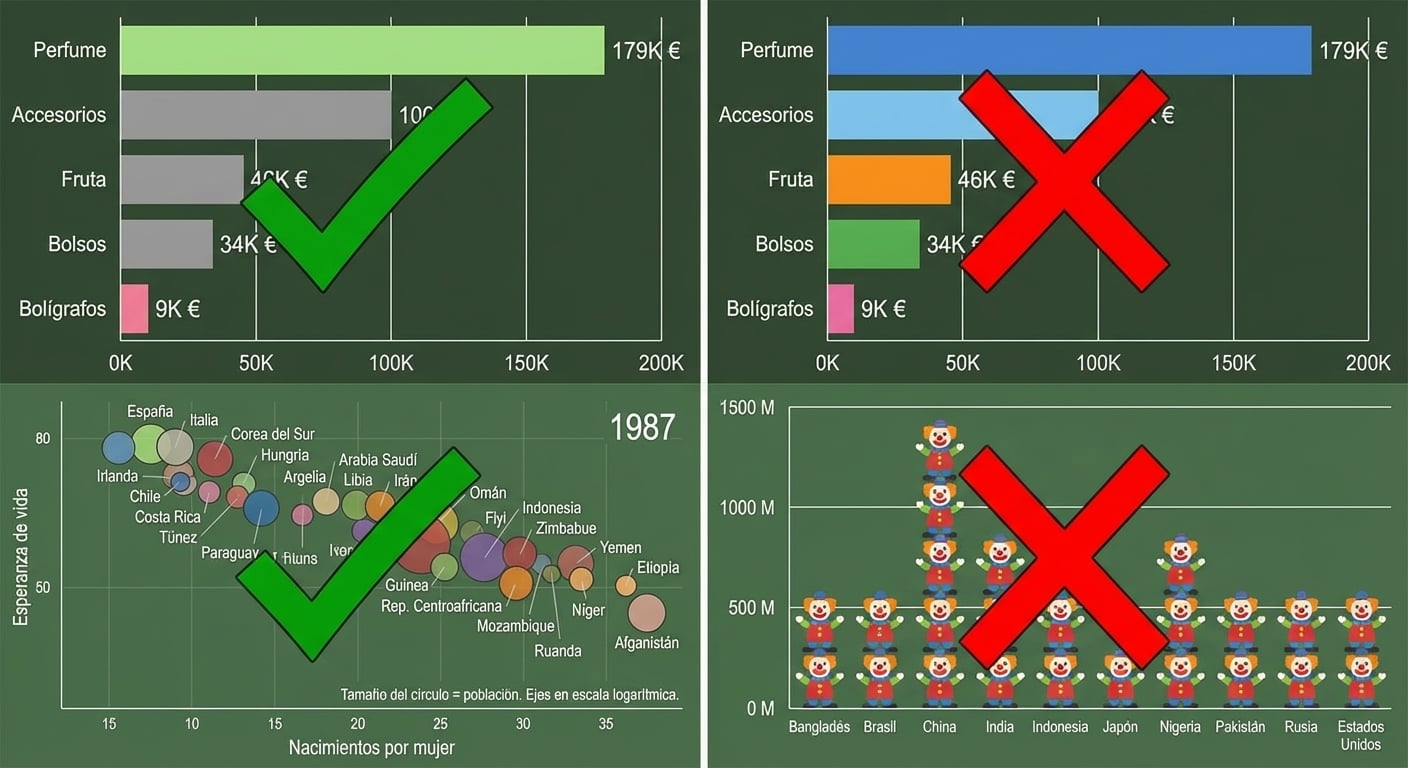
Buenas prácticas de data viz
Gráficos dinámicos y paneles
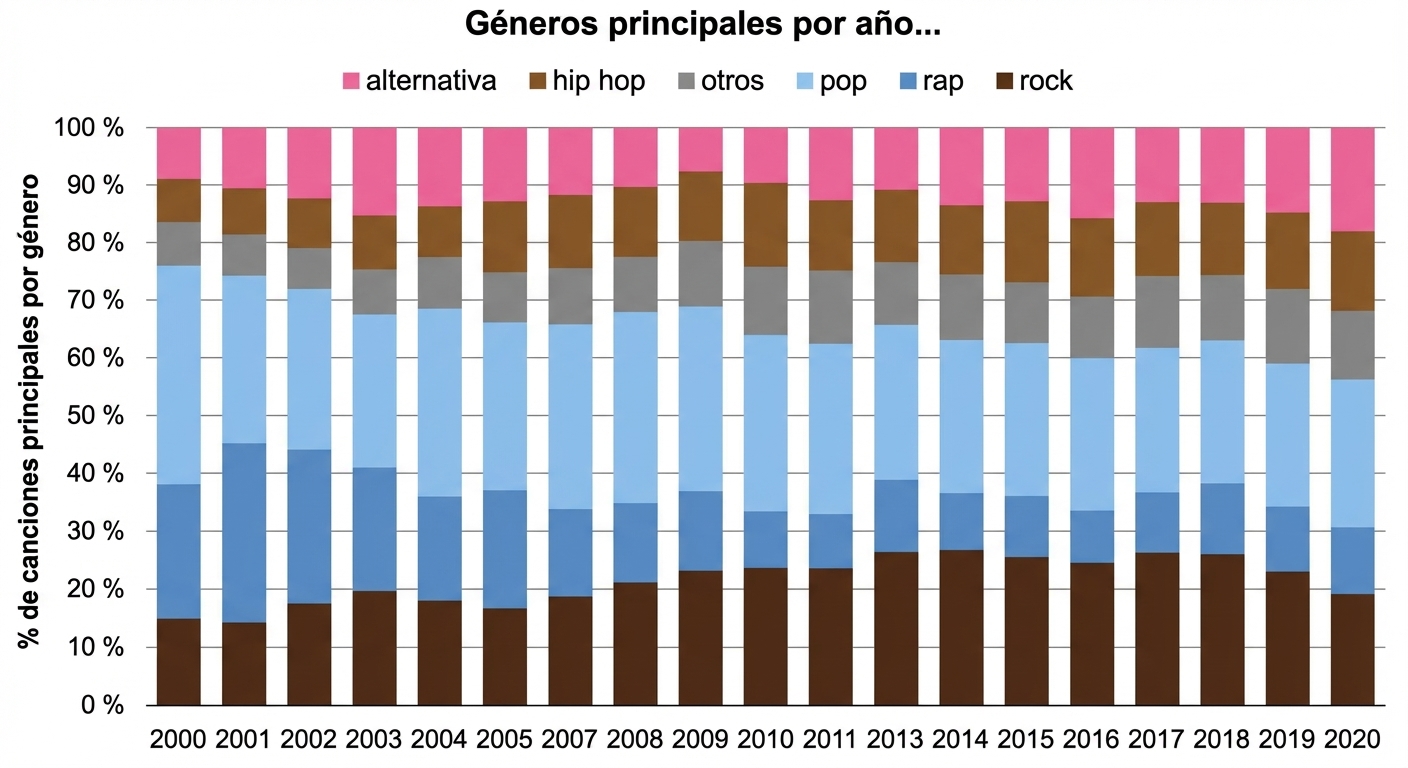
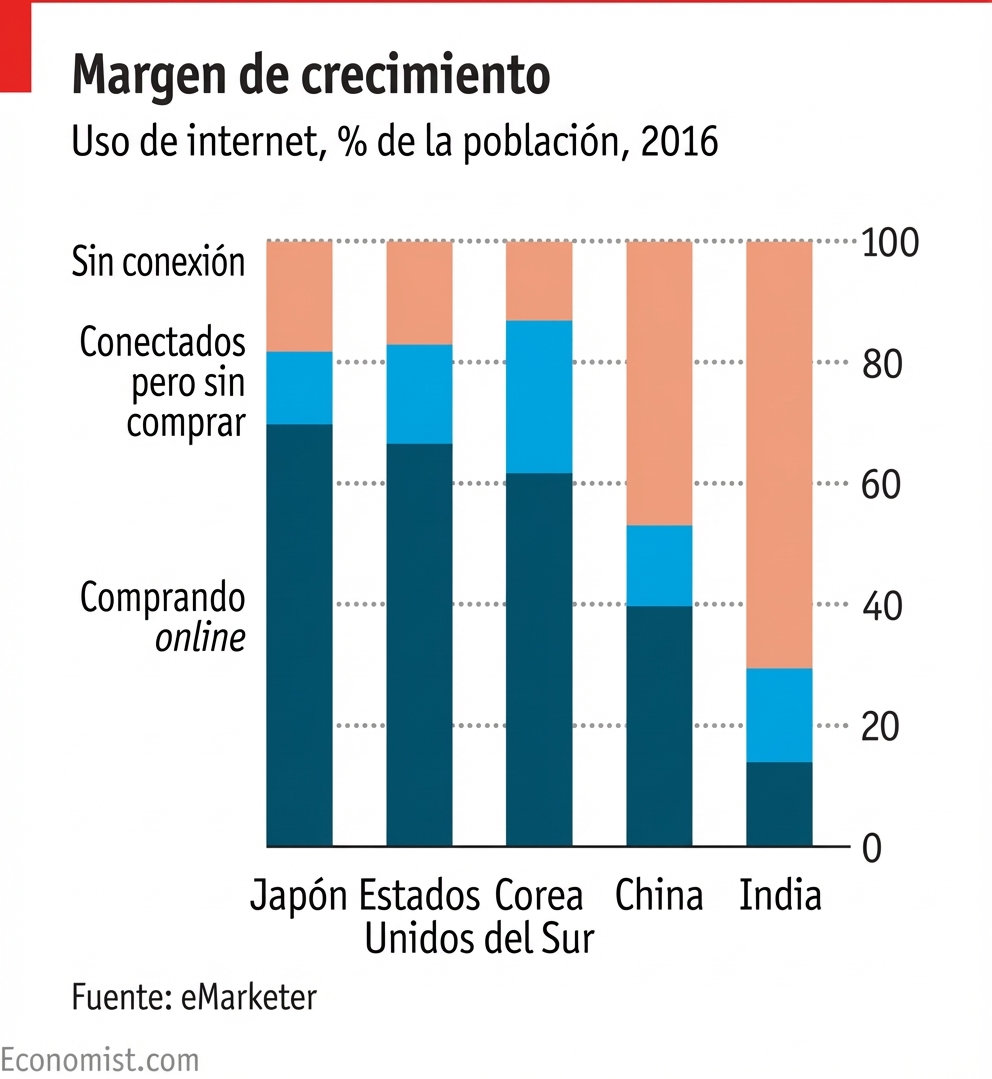
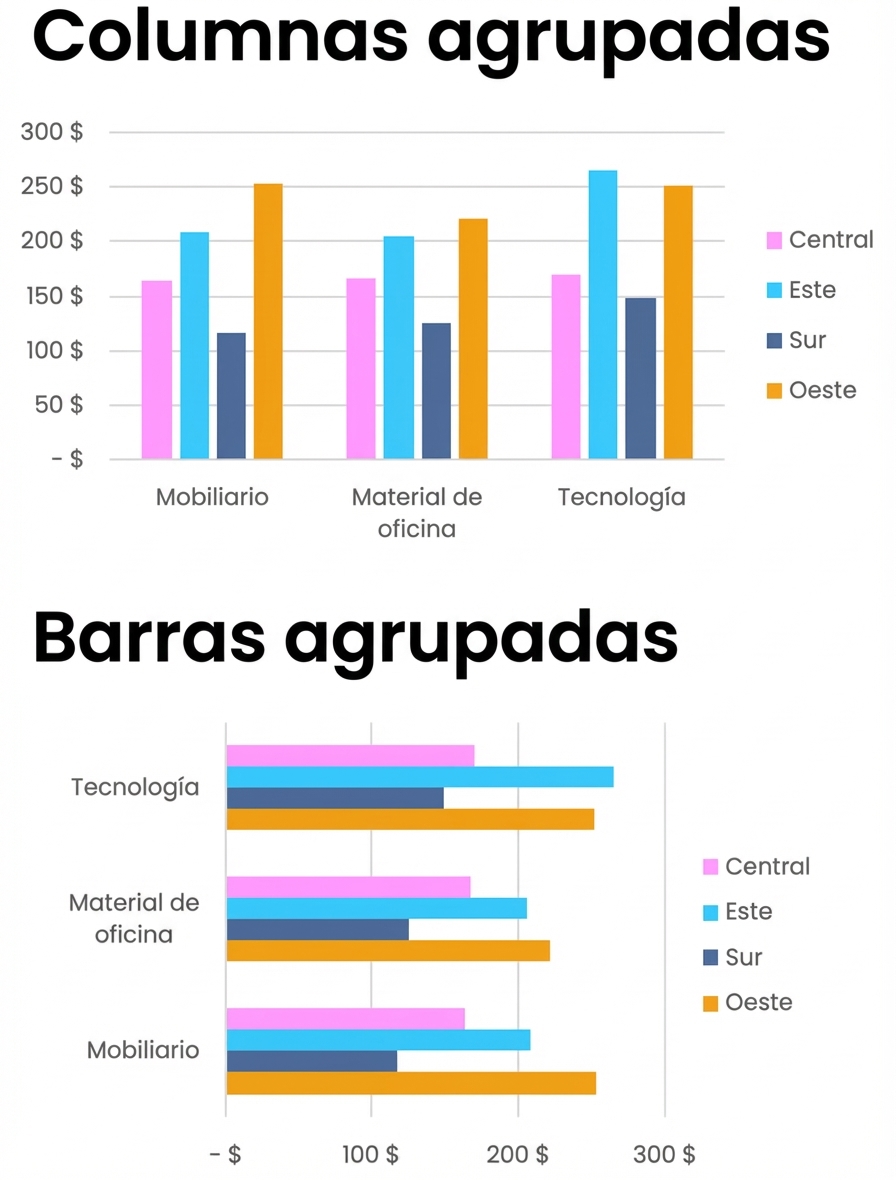
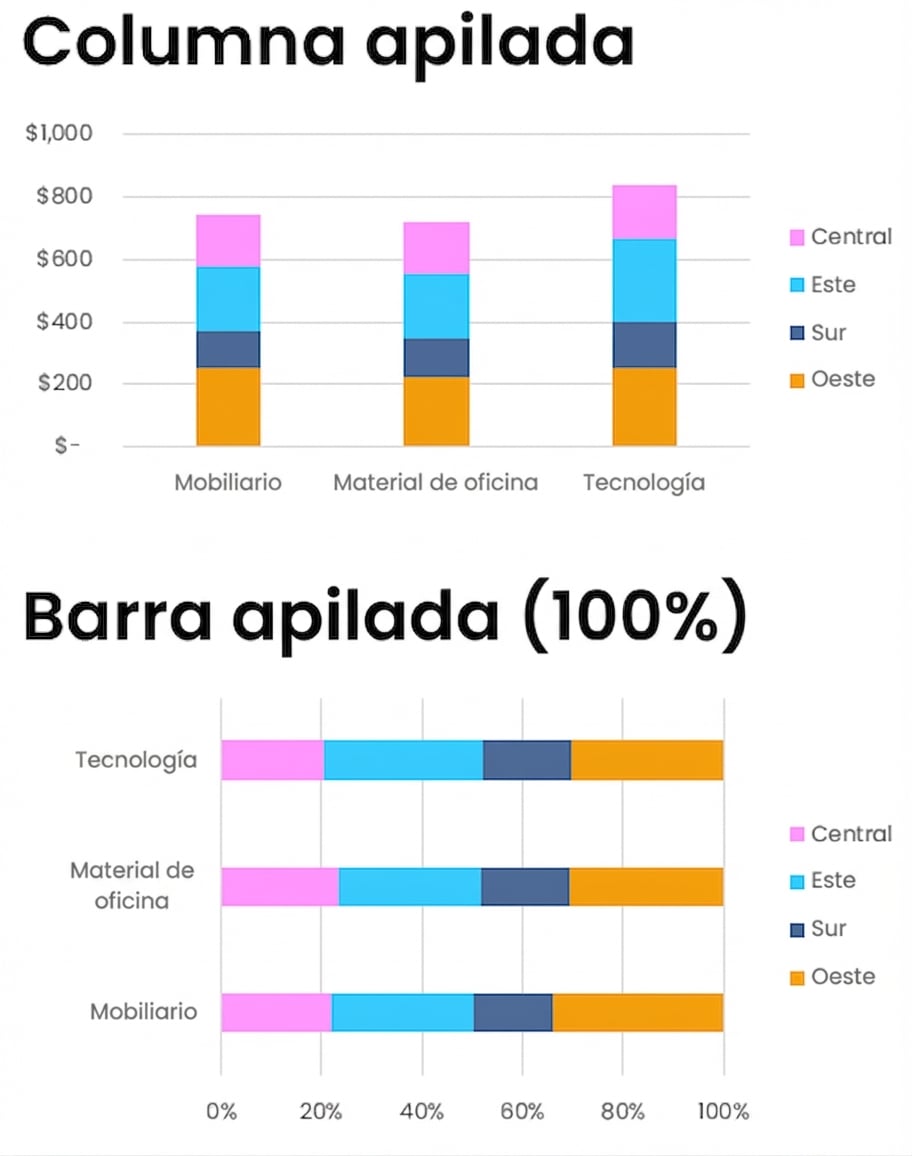
Gráficos de barras y columnas
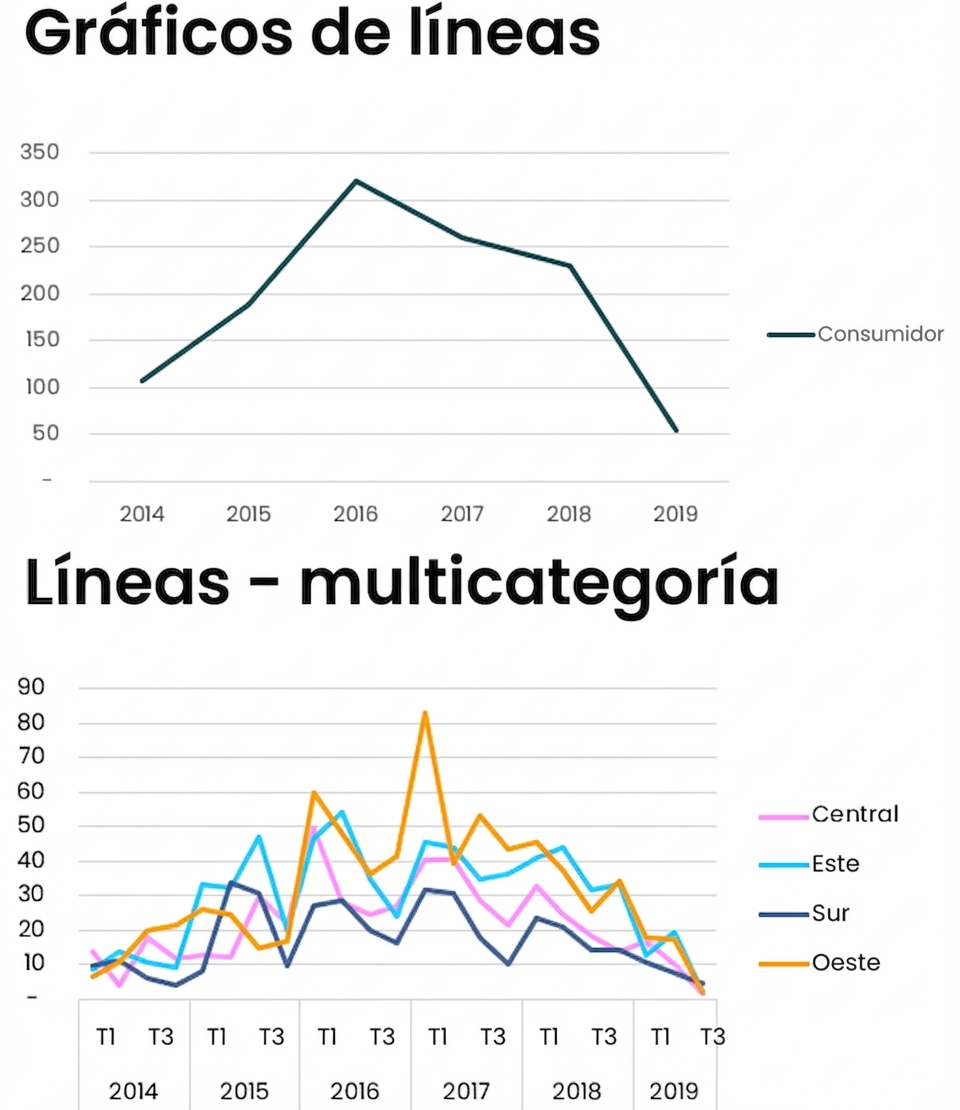
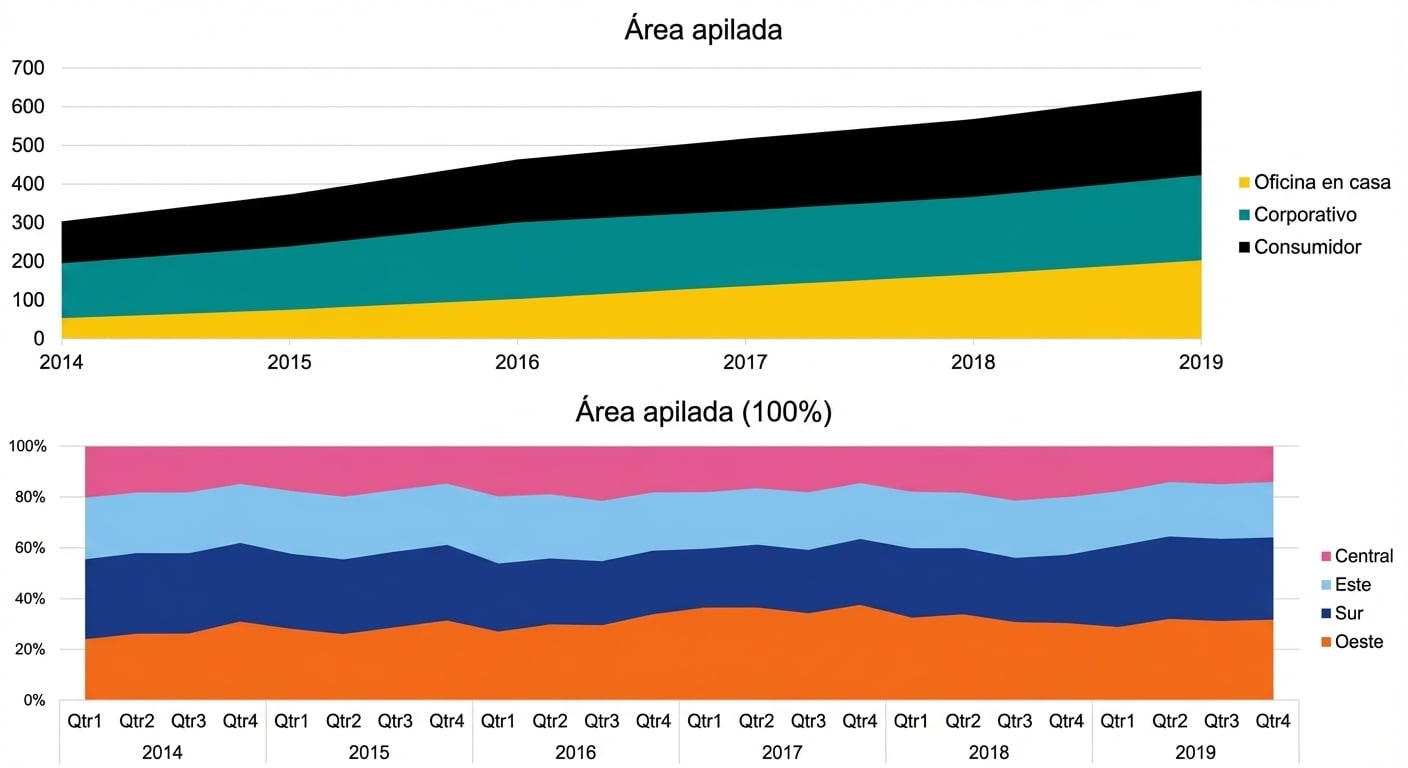
Líneas y áreas
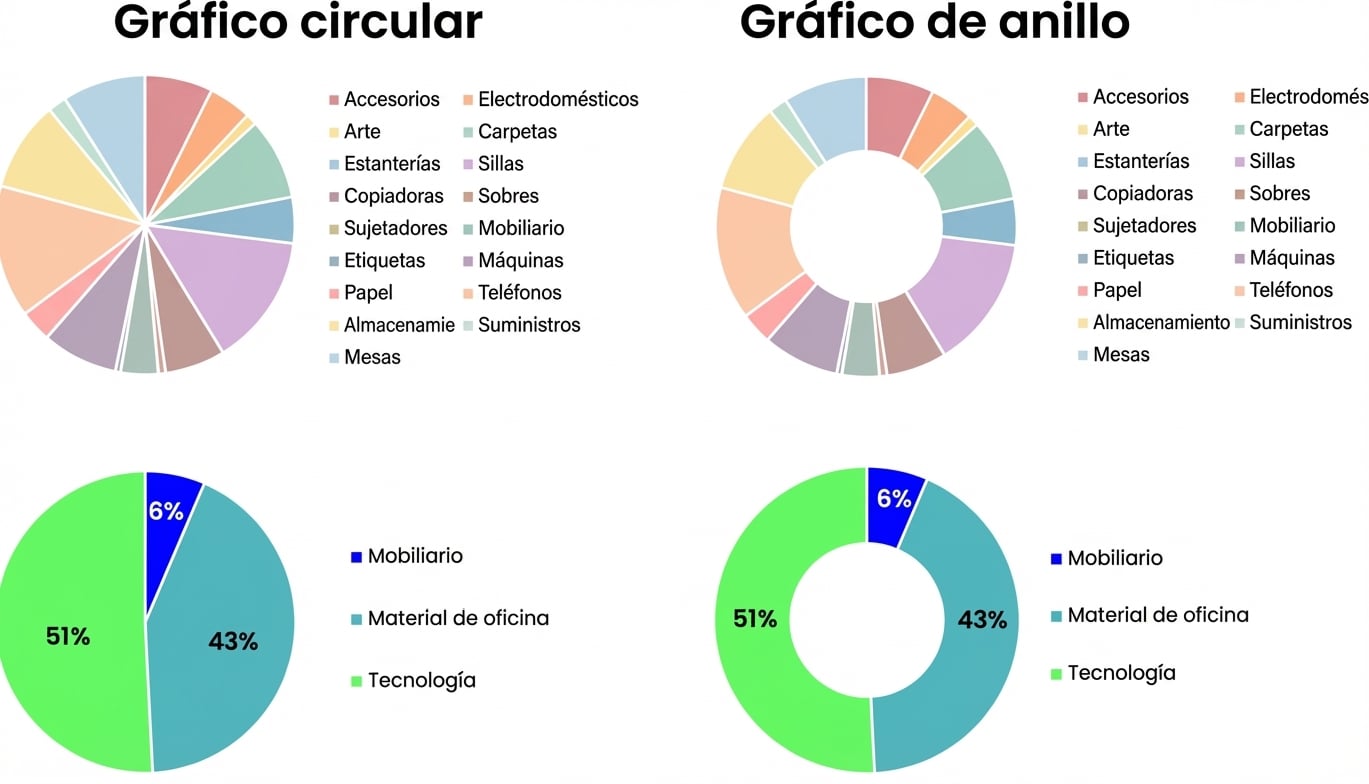
Tartas y rosquillas
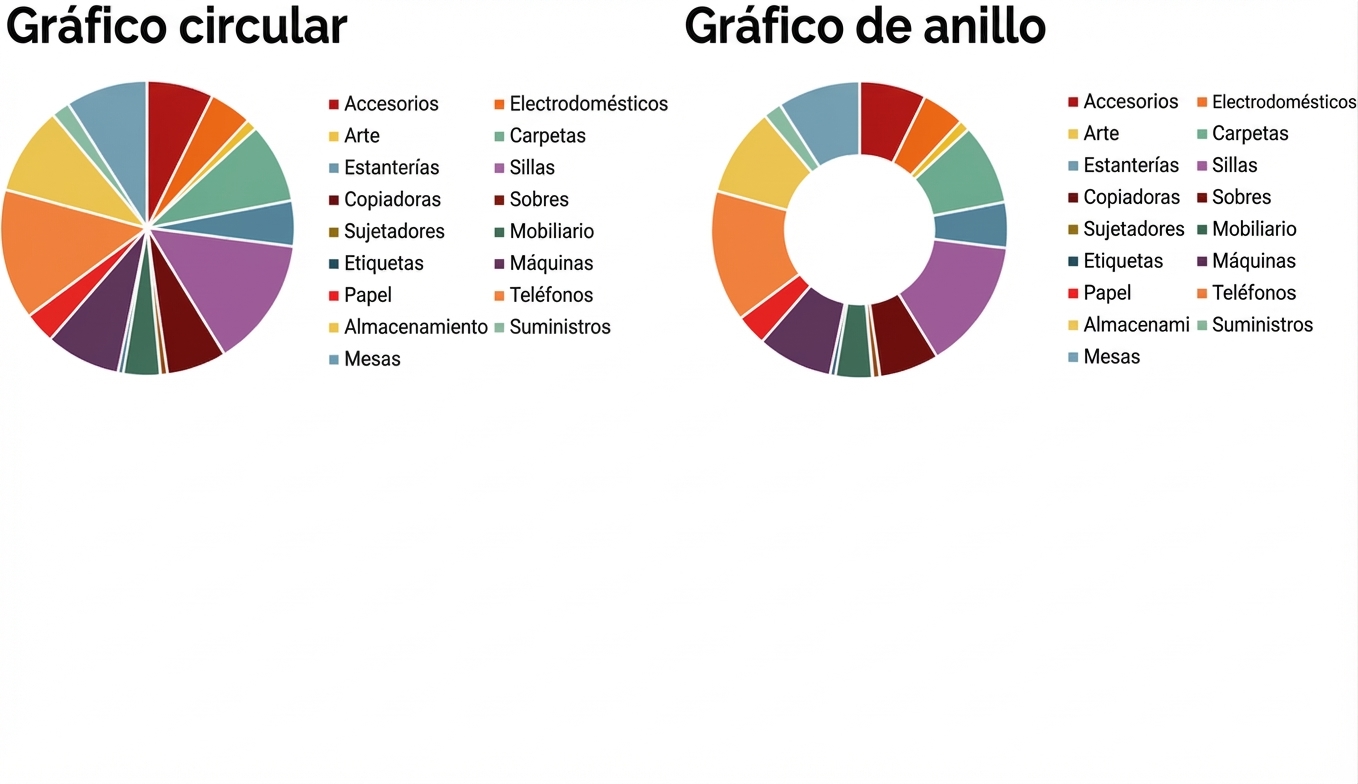
Tartas y rosquillas
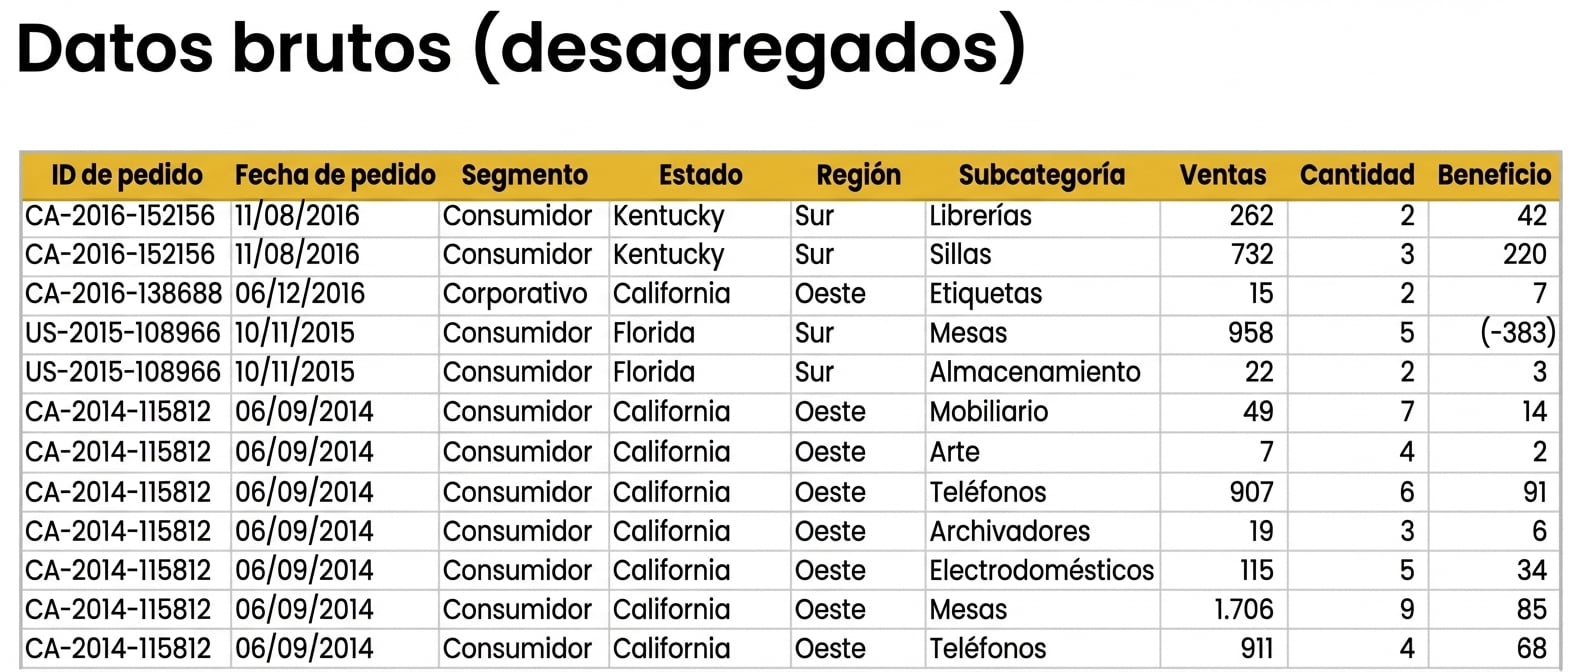
Nuestro conjunto de datos: «We Have It All»
- Conjunto de datos comercial
- Ventas y pedidos de unos grandes almacenes
- Varias dimensiones, p. ej., región, categoría de producto
- Varias medidas, p. ej., ventas, beneficio, descuentos
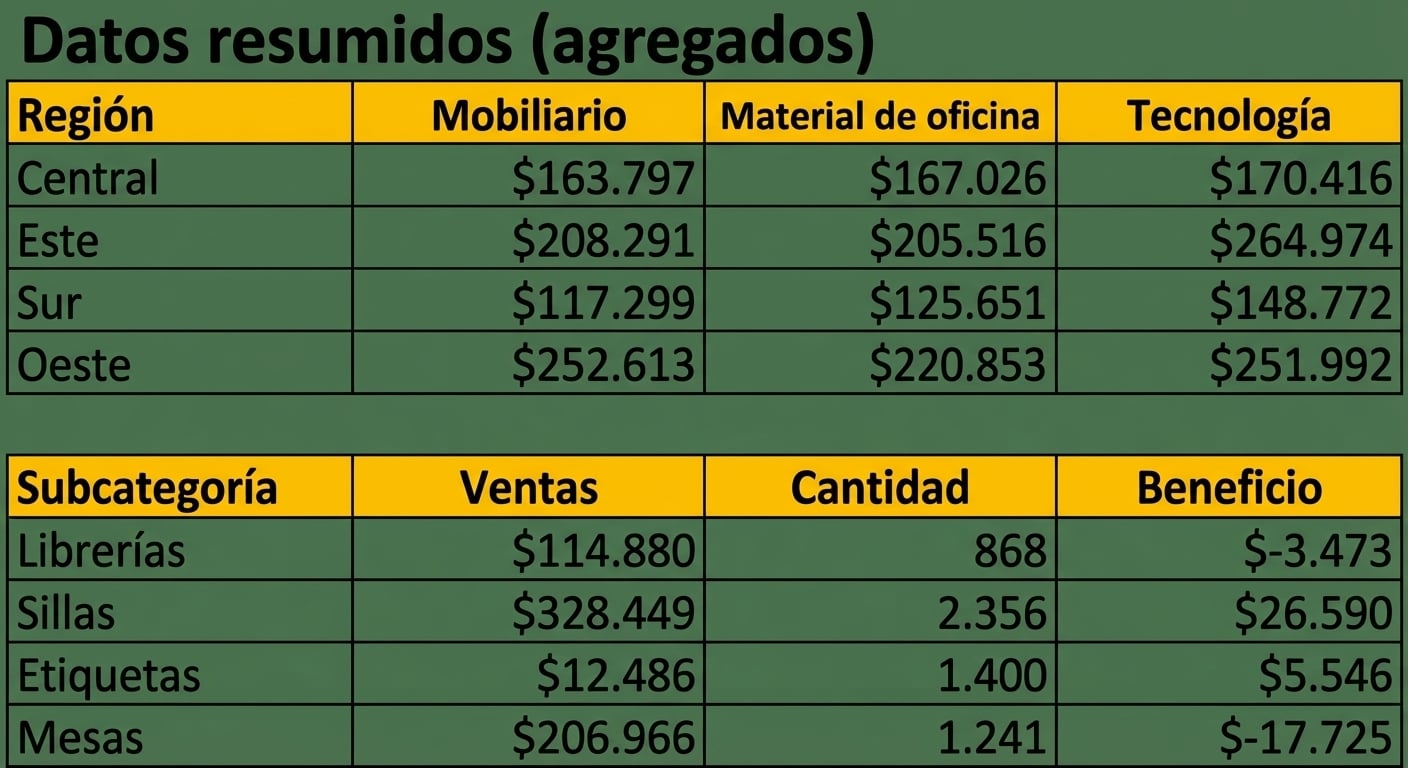
- Datos desagregados = datos en bruto
- Datos agregados = tablas resumen