Exploring categorical data

Exploratory Data Analysis in R

Andrew Bray

Assistant Professor, Reed College

Comics dataset

comics
# A tibble: 23,272 x 11
                                    name               id   align
                                  <fct>           <fct>  <fct>
1              Spider-Man (Peter Parker)  Secret Identity    Good
2        Captain America (Steven Rogers)  Public Identity    Good
3  Wolverine (James \\"Logan\\" Howlett)  Public Identity Neutral
4    Iron Man (Anthony \\"Tony\\" Stark)  Public Identity    Good
5                    Thor (Thor Odinson) No Dual Identity    Good
6             Benjamin Grimm (Earth-616)  Public Identity    Good
7              Reed Richards (Earth-616)  Public Identity    Good
8             Hulk (Robert Bruce Banner)  Public Identity    Good
9              Scott Summers (Earth-616)  Public Identity Neutral
10            Jonathan Storm (Earth-616)  Public Identity    Good
# ... with 23,262 more rows, and 8 more variables: eye <fct>,
#   hair <fct>, gender <fct>, gsm <fct>, alive <fct>,
#   appearances <int>, first_appear <fct>, publisher <fct>
Exploratory Data Analysis in R

Working with factors

levels(comics$align)
"Bad"                "Good"               "Neutral"           
"Reformed Criminals"
levels(comics$id)
"No Dual" "Public"  "Secret"  "Unknown"  # Note: NAs ignored by levels() function
table(comics$id, comics$align)

         Bad Good Neutral Reformed Criminals
No Dual  474  647     390                  0
Public  2172 2930     965                  1
Secret  4493 2475     959                  1
Unknown    7    0       2                  0
Exploratory Data Analysis in R

ch1_1.002.png

Exploratory Data Analysis in R

ch1_1.003.png

Exploratory Data Analysis in R

Bar chart

library(ggplot2) # Load package
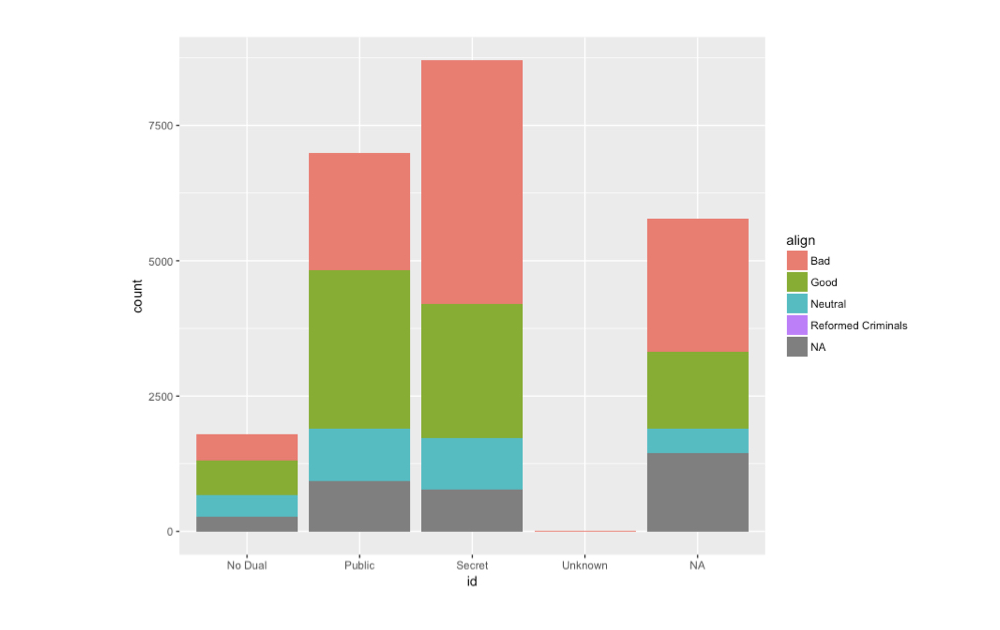
ggplot(comics, aes(x = id, fill = align)) +
    geom_bar()

ch1_1.005.png

Exploratory Data Analysis in R

Let's practice!

Exploratory Data Analysis in R

Preparing Video For Download...