Medidas de variabilidad
Análisis exploratorio de datos en R

Andrew Bray
Assistant Professor, Reed College
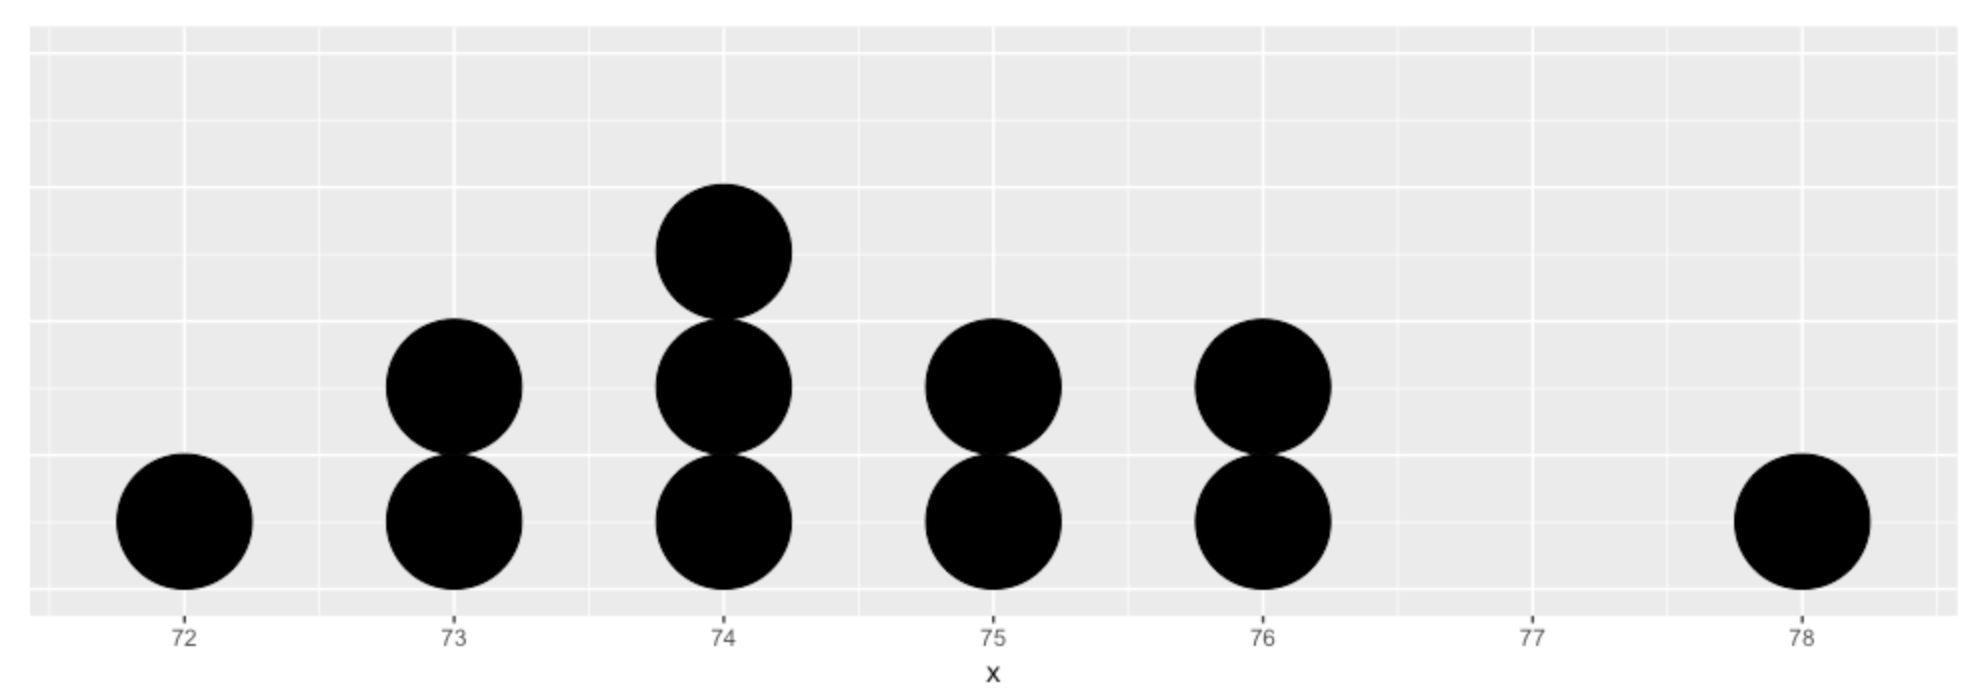
x
76 78 75 74 76 72 74 73 73 75 74
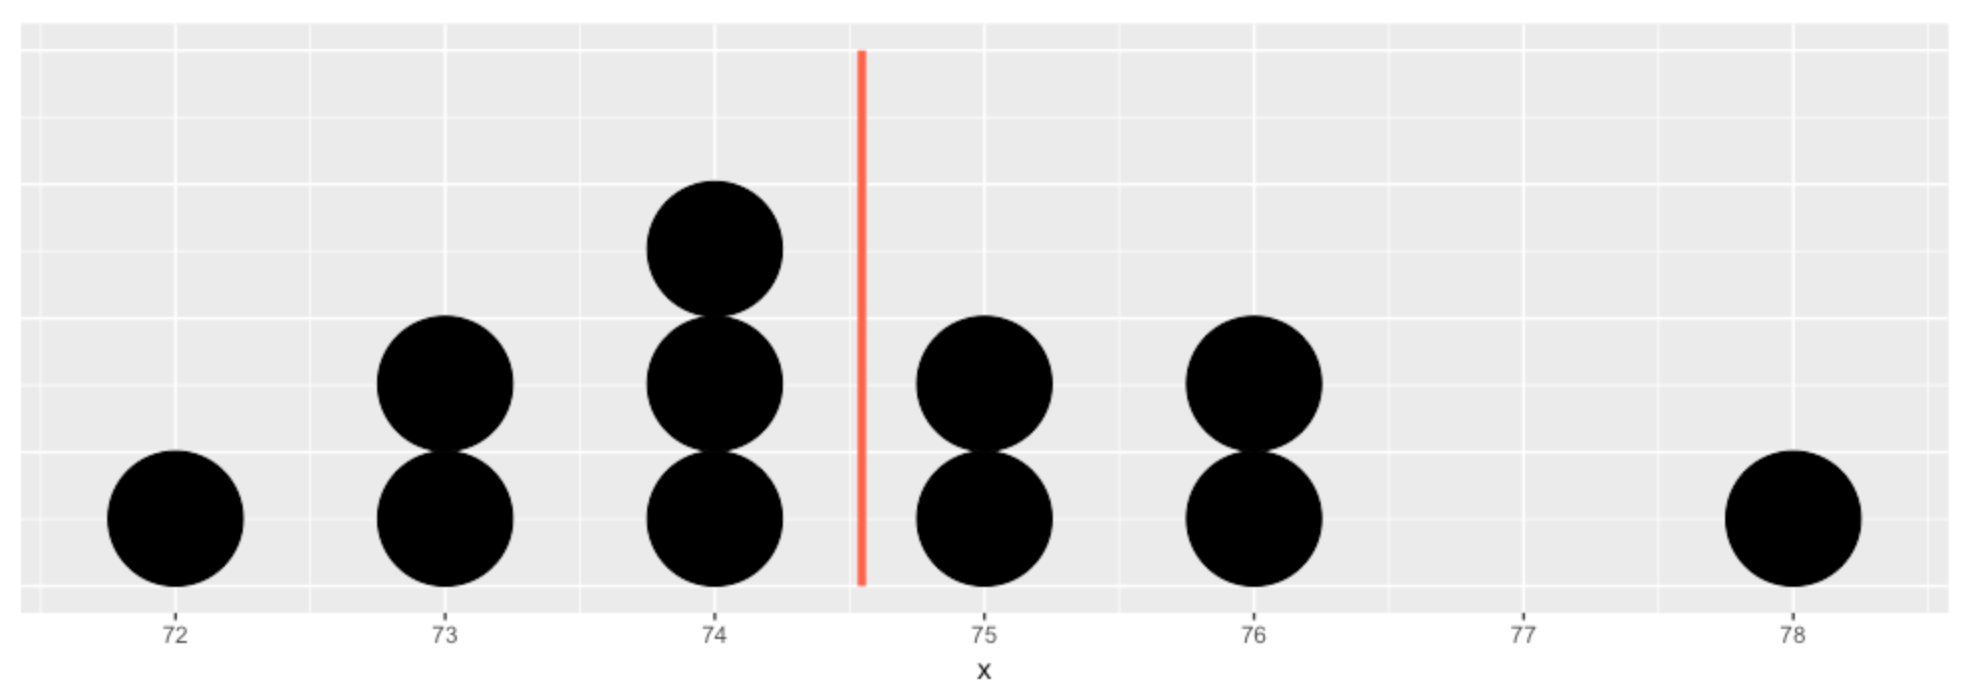
x
76 78 75 74 76 72 74 73 73 75 74
x - mean(x)
 1.4545  3.4545  0.4545 -0.5455  1.4545 -2.5455
-0.5455 -1.5455 -1.5455  0.4545 -0.5455
sum(x - mean(x))
-1.421085e-14
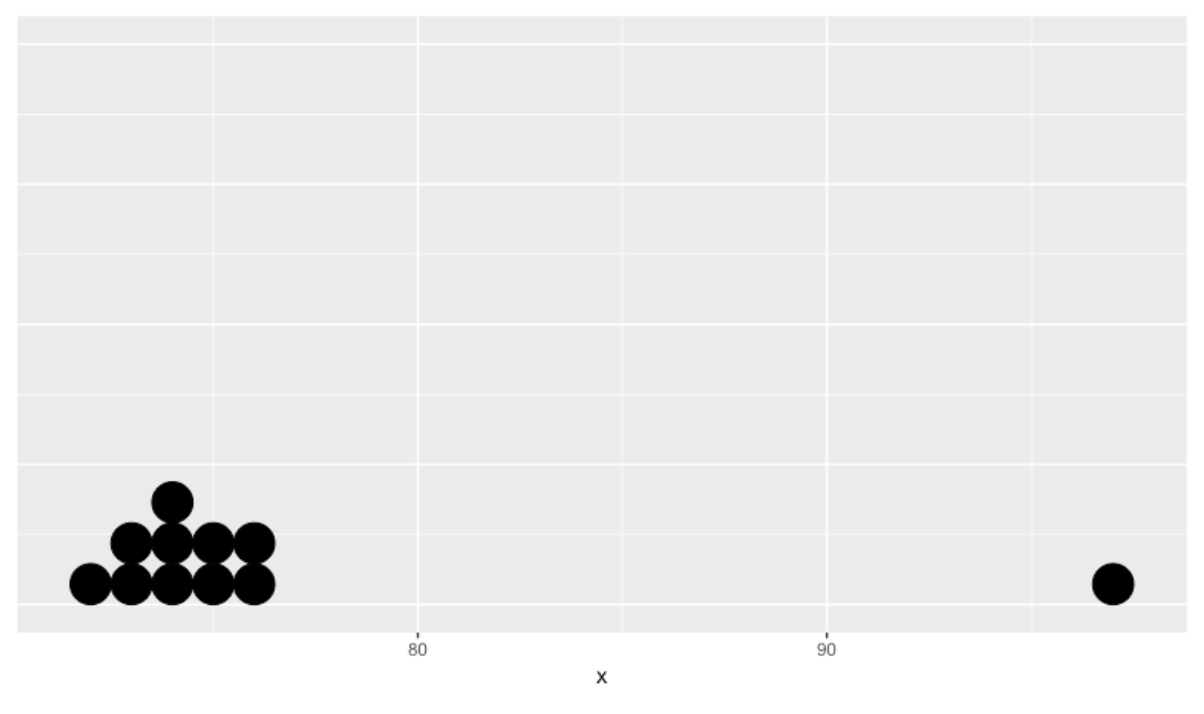
x
76 78 75 74 76 72 74 73 73 75 74
x_new
76 97 75 74 76 72 74 73 73 75 74

