Personalização
Python intermediário

Hugo Bowne-Anderson
Data Scientist at DataCamp
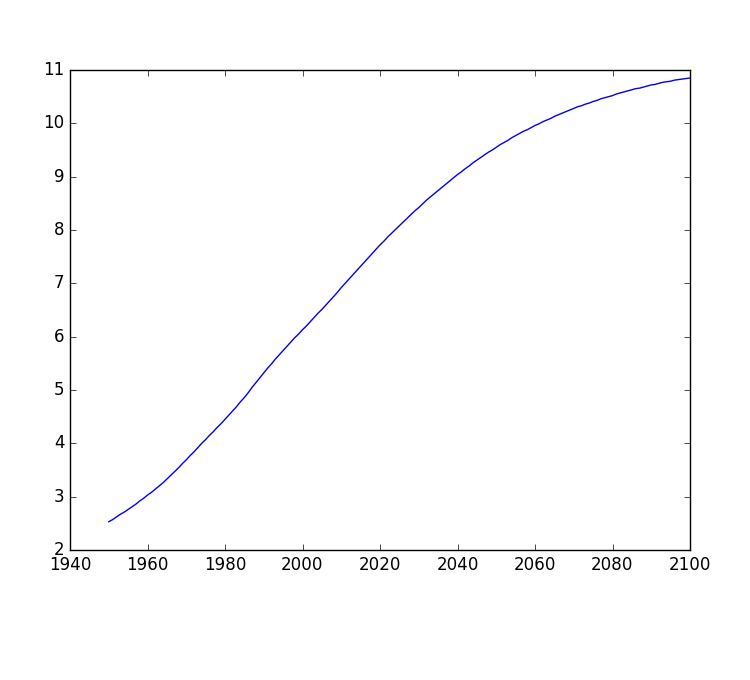
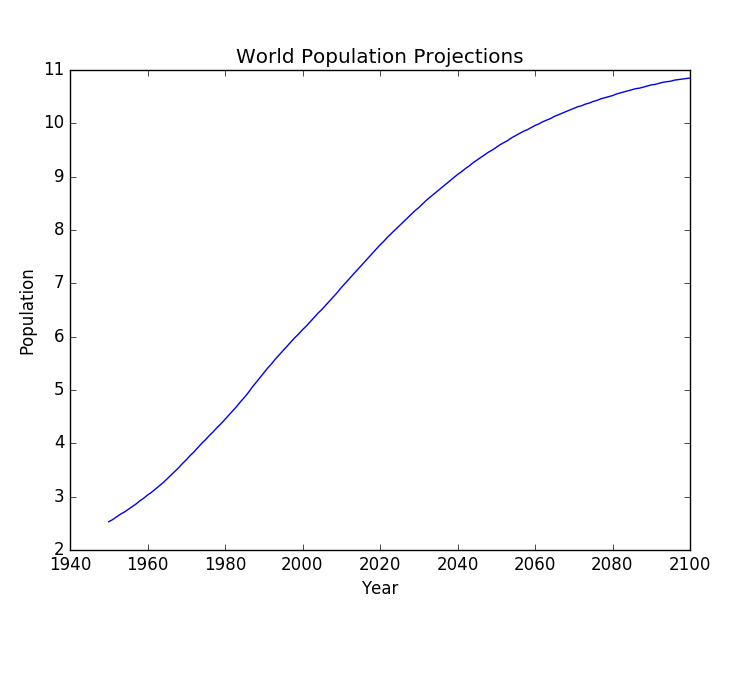
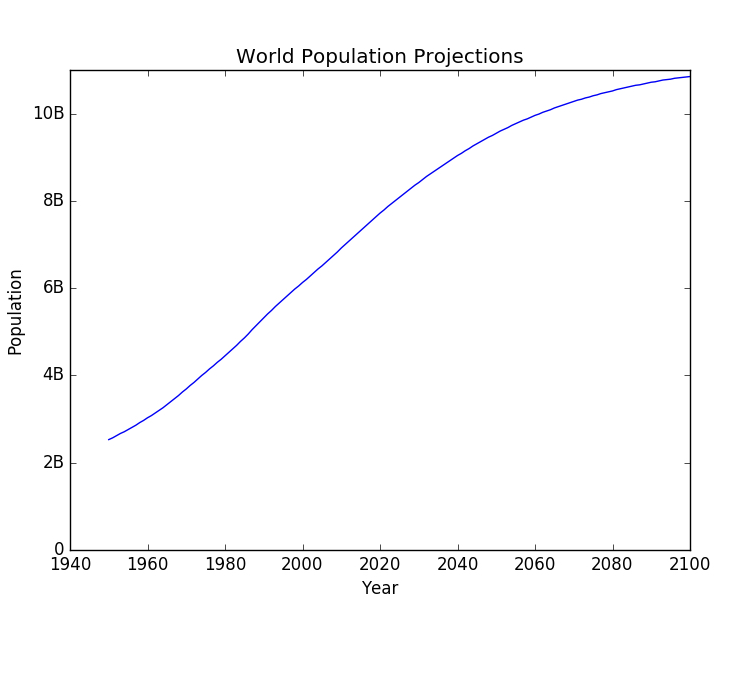
Gráfico básico
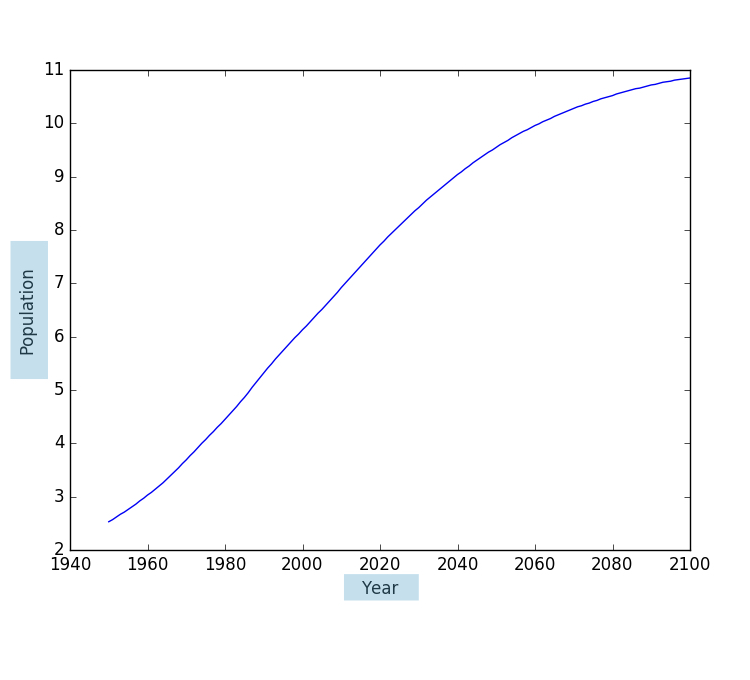
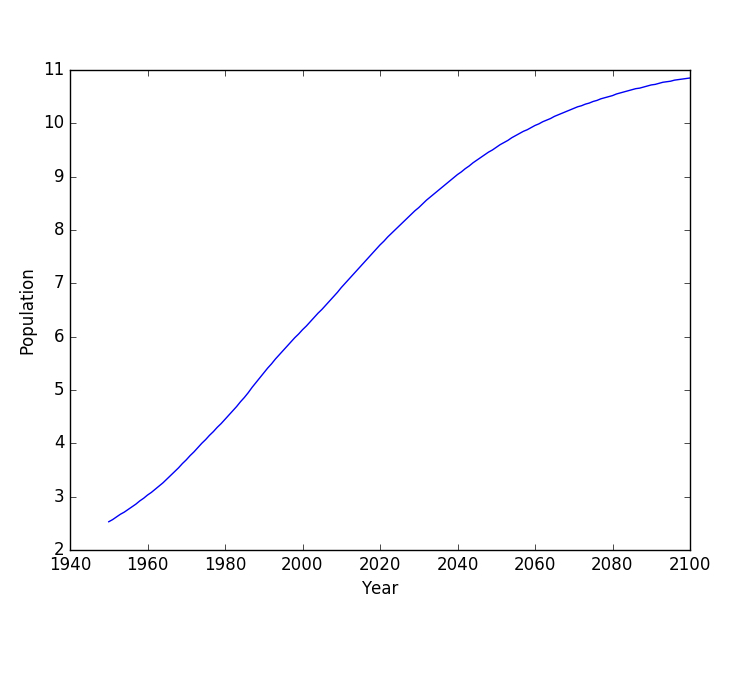
Rótulos de eixos
Rótulos de eixos
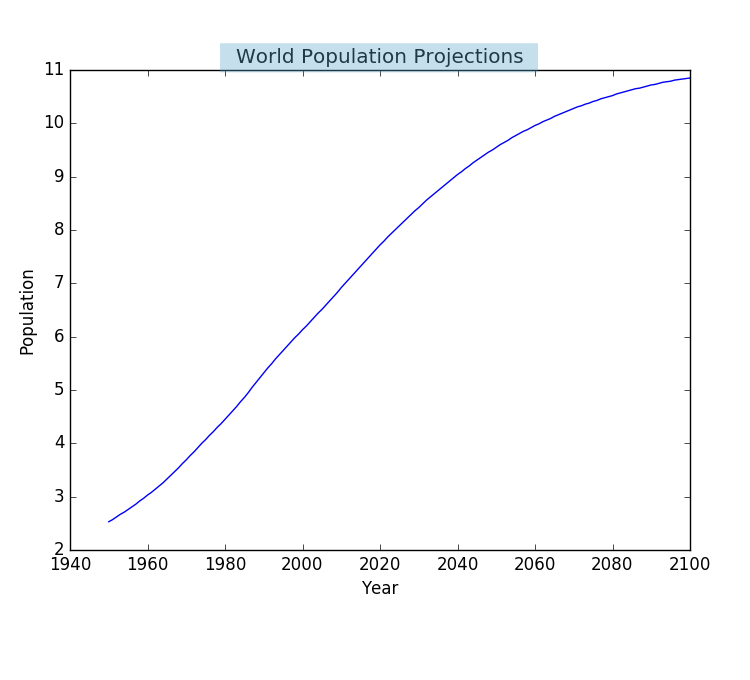
Título:
Título:
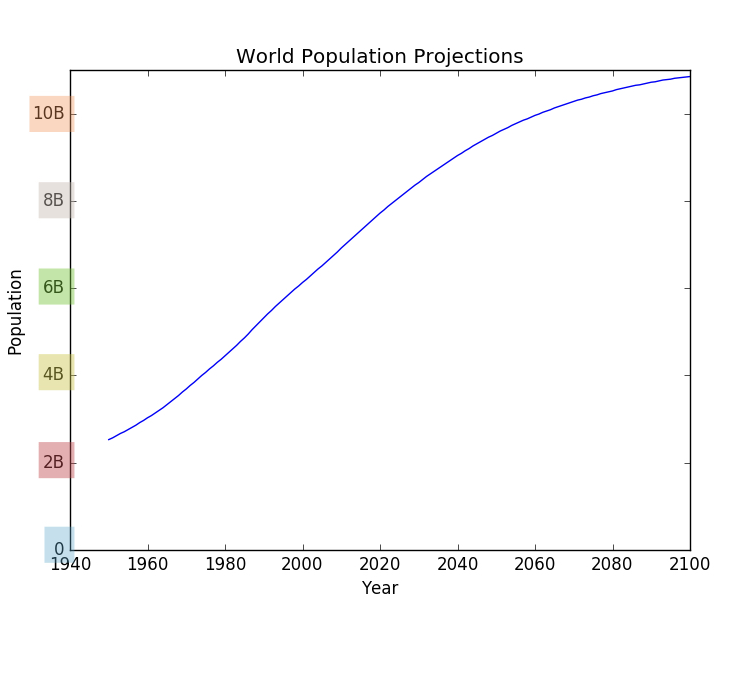
Marcas de escala
Marcas de escala
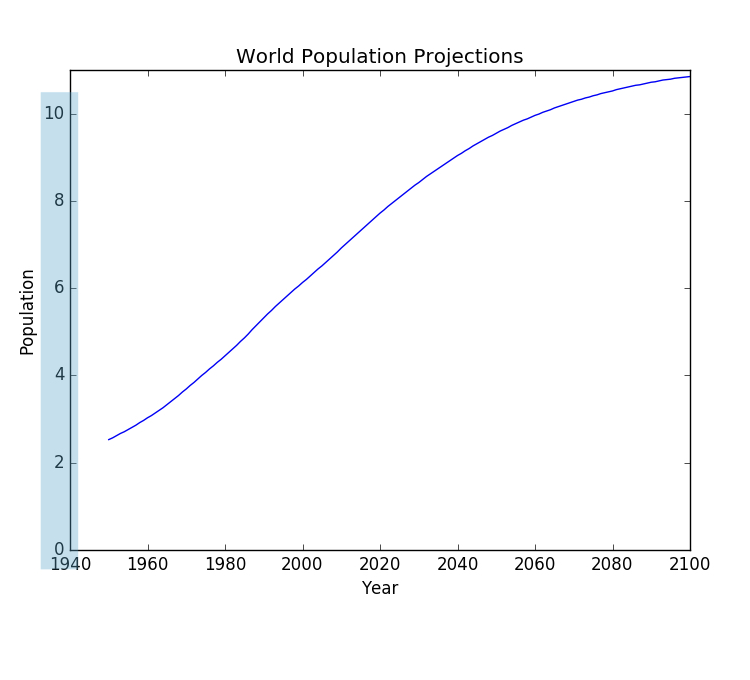
Marcas de escala
Marcas de escala
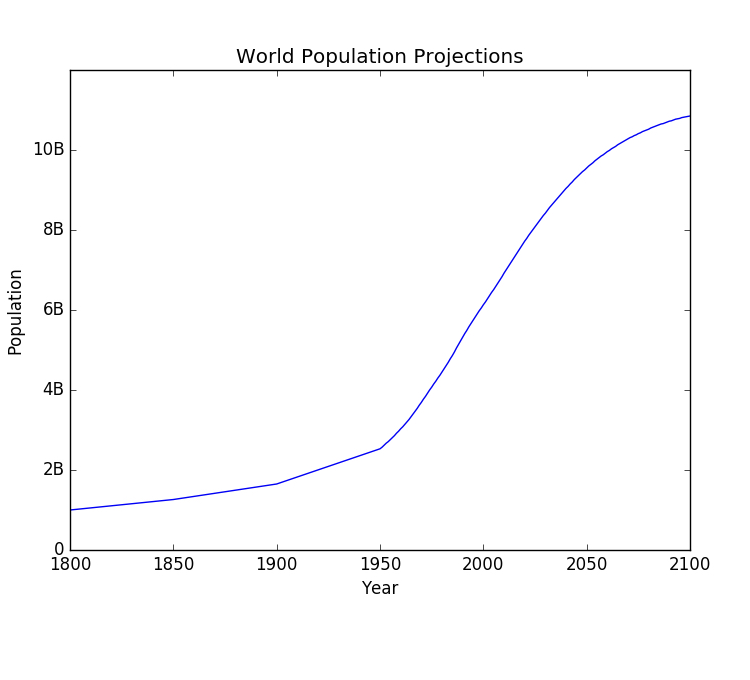
Adicionar dados históricos
Adicionar dados históricos
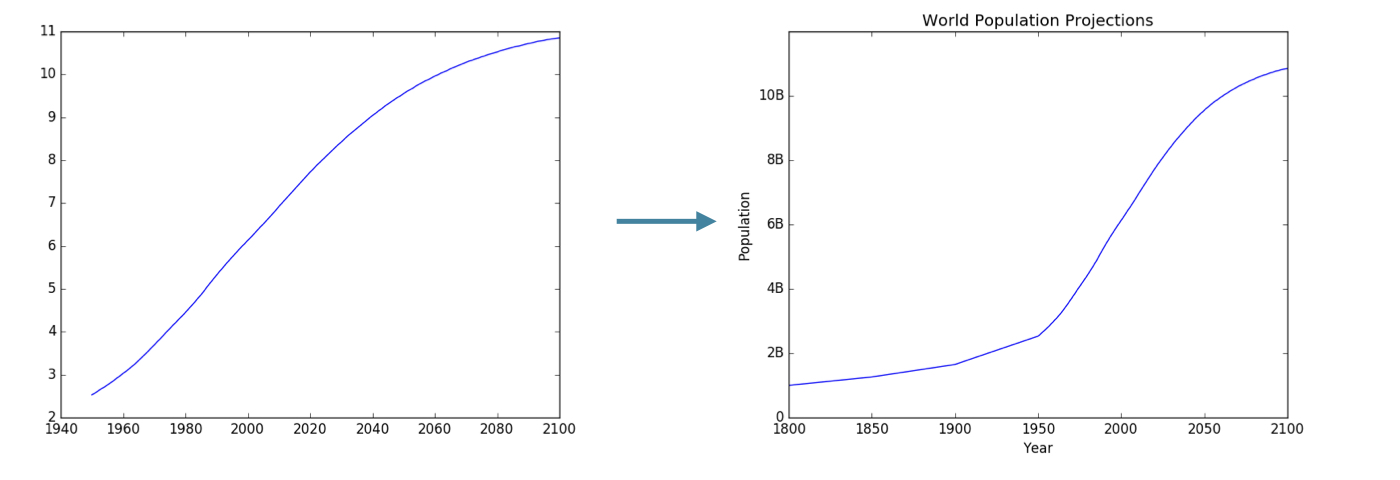
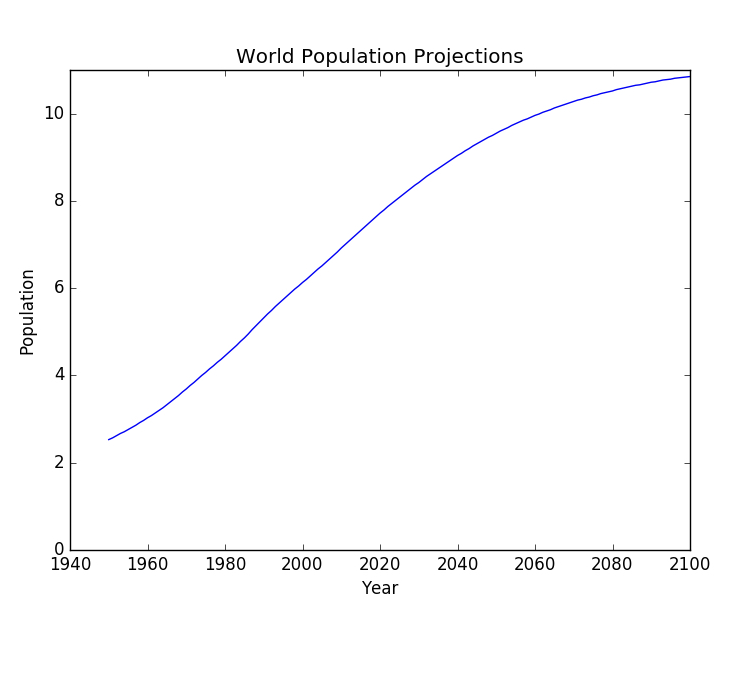
Antes x depois