Gráficos básicos com a Matplotlib
Python intermediário

Hugo Bowne-Anderson
Data Scientist at DataCamp
Gráficos básicos com a Matplotlib
- Visualização

- Estrutura de dados

- Estruturas de controle

- Estudo de caso:

Visualização de dados
Muito importante na análise de dados
- Explore os dados
- Relatório de insights
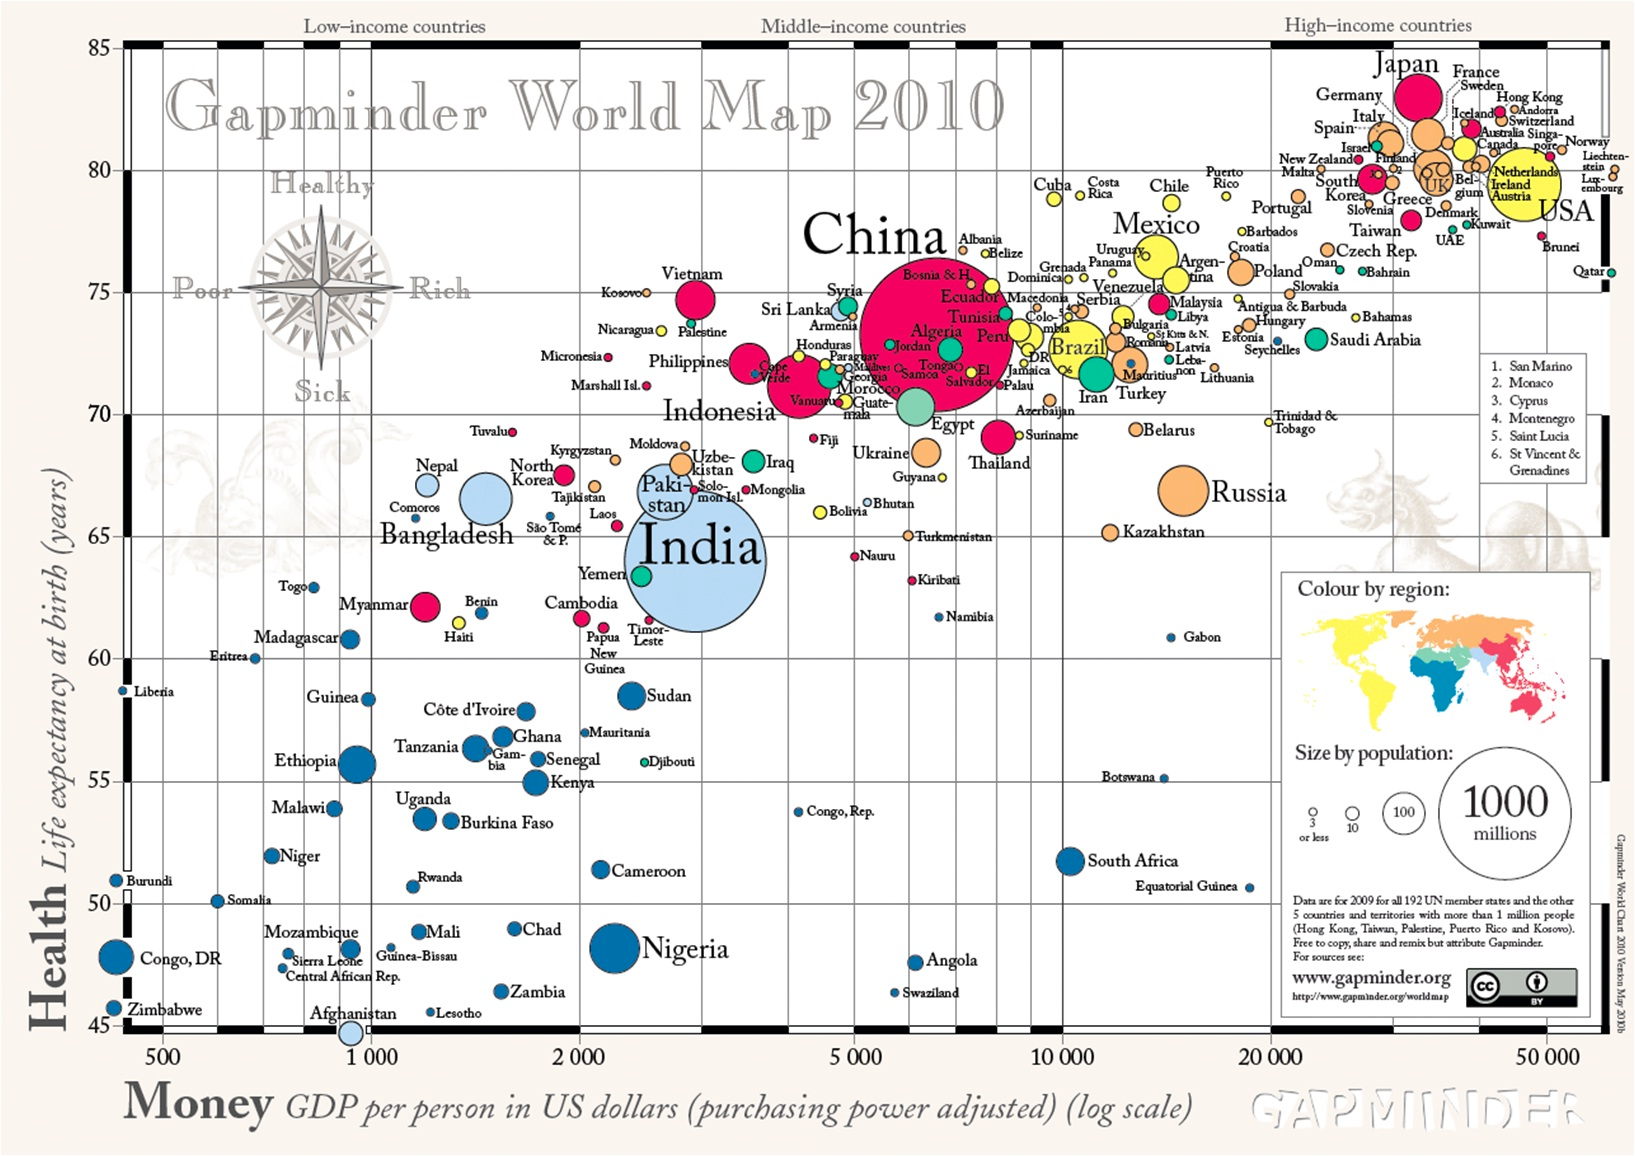
1 Fonte: GapMinder, Wealth and Health of Nations
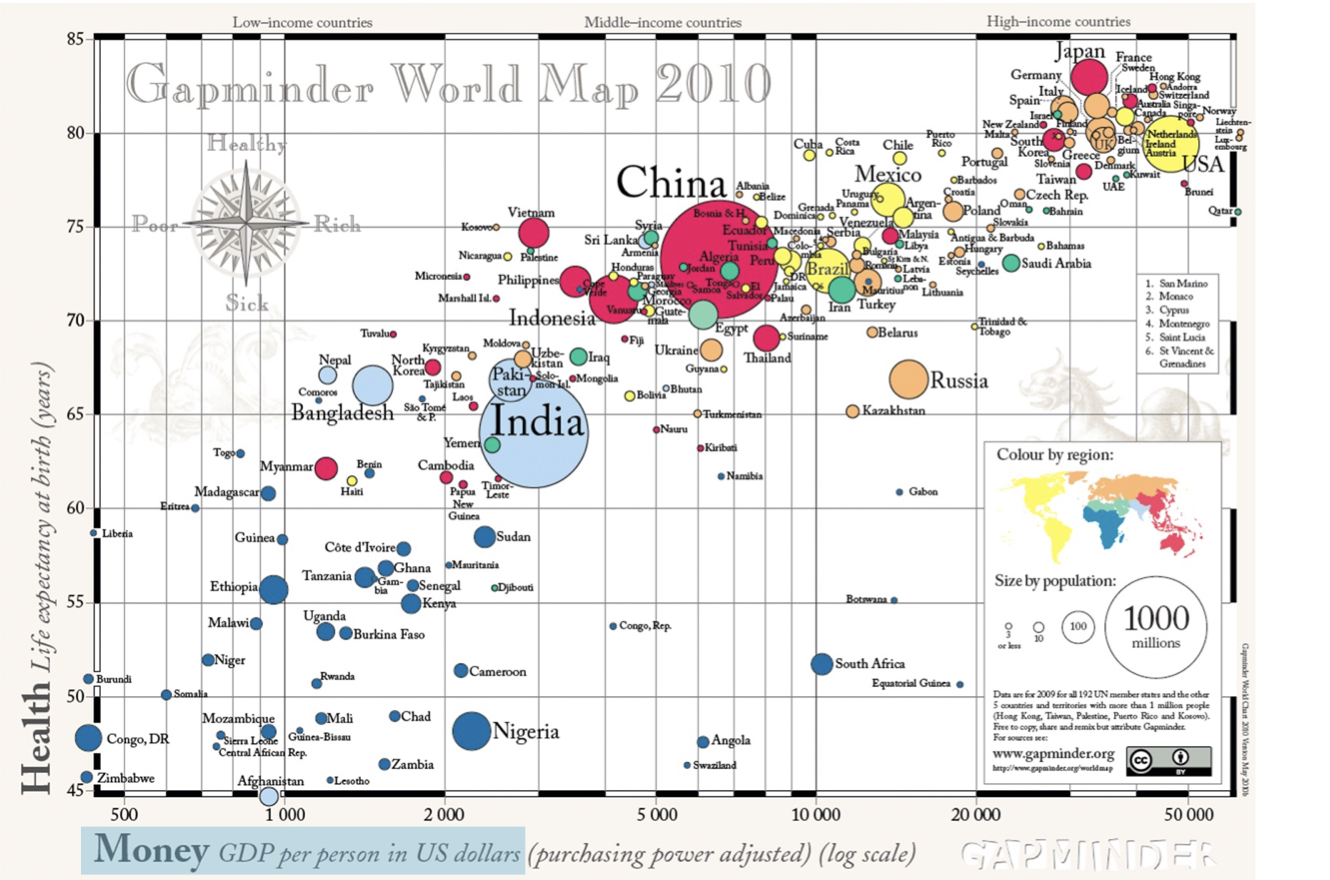
1 Fonte: GapMinder, Wealth and Health of Nations
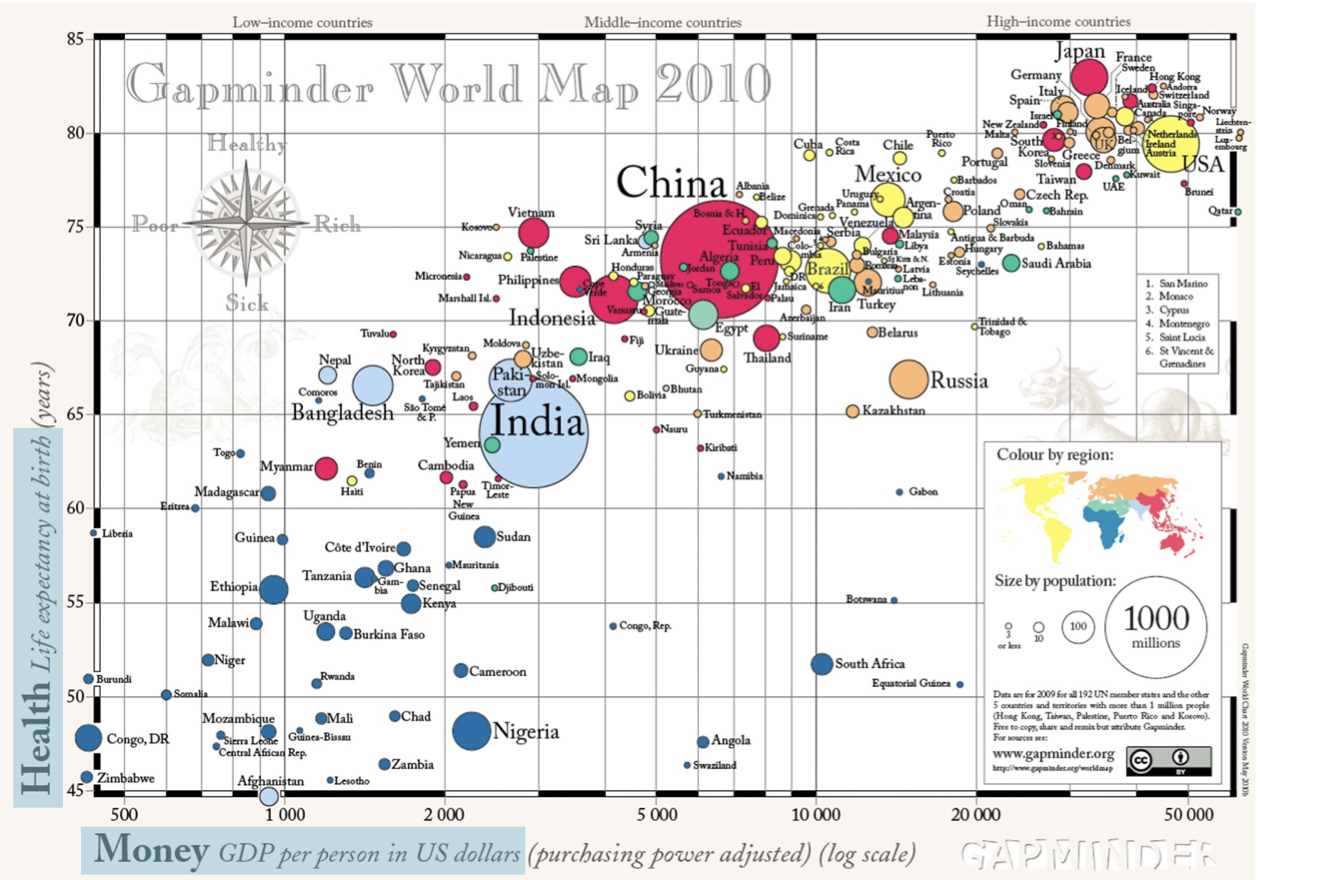
1 Fonte: GapMinder, Wealth and Health of Nations
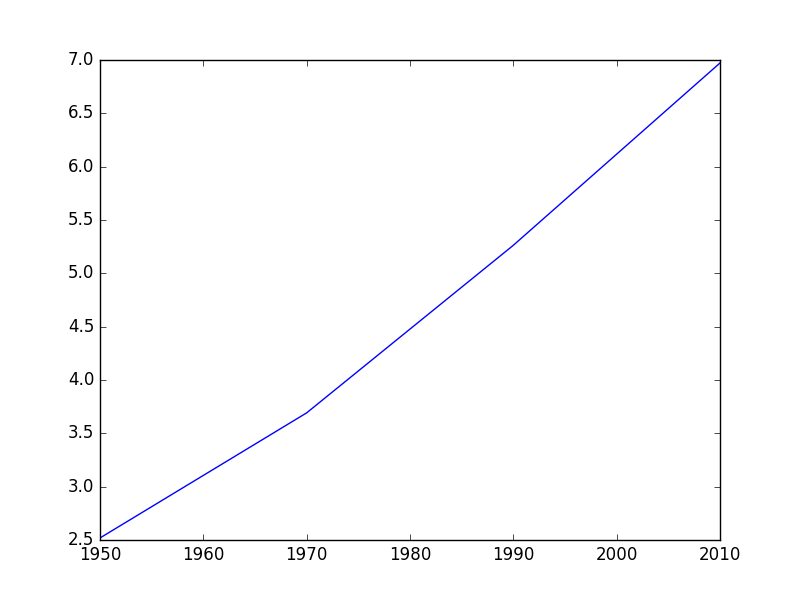
Matplotlib
import matplotlib.pyplot as pltyear = [1950, 1970, 1990, 2010]pop = [2.519, 3.692, 5.263, 6.972]plt.plot(year, pop)plt.show()
Matplotlib
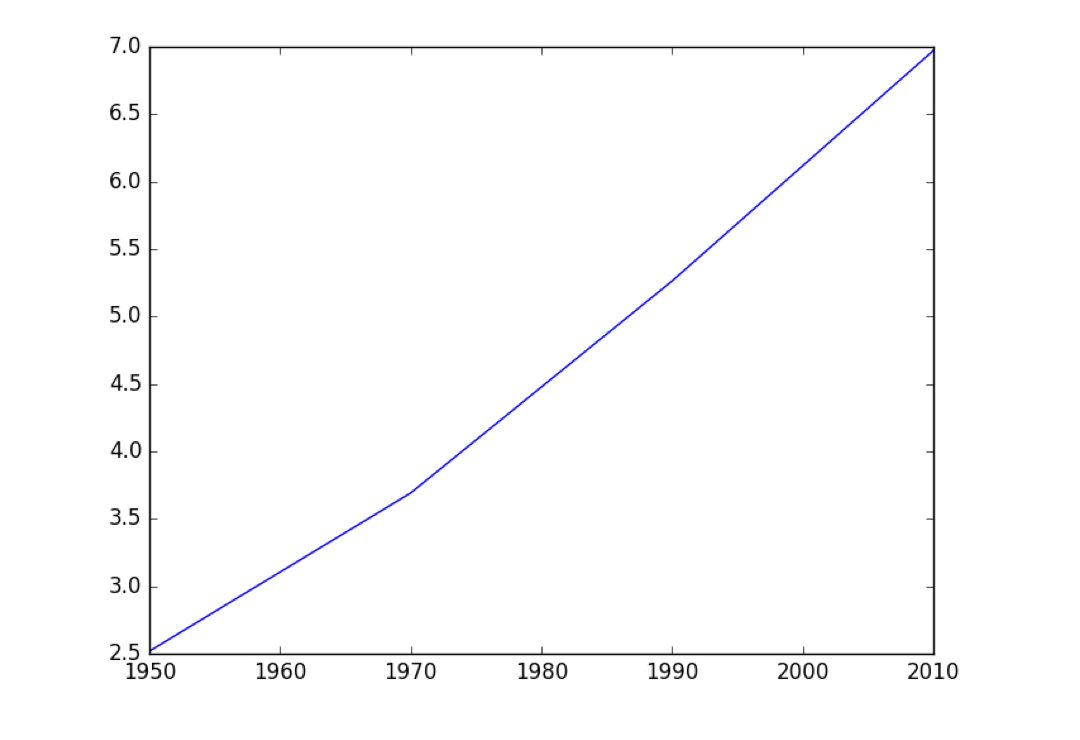
Matplotlib
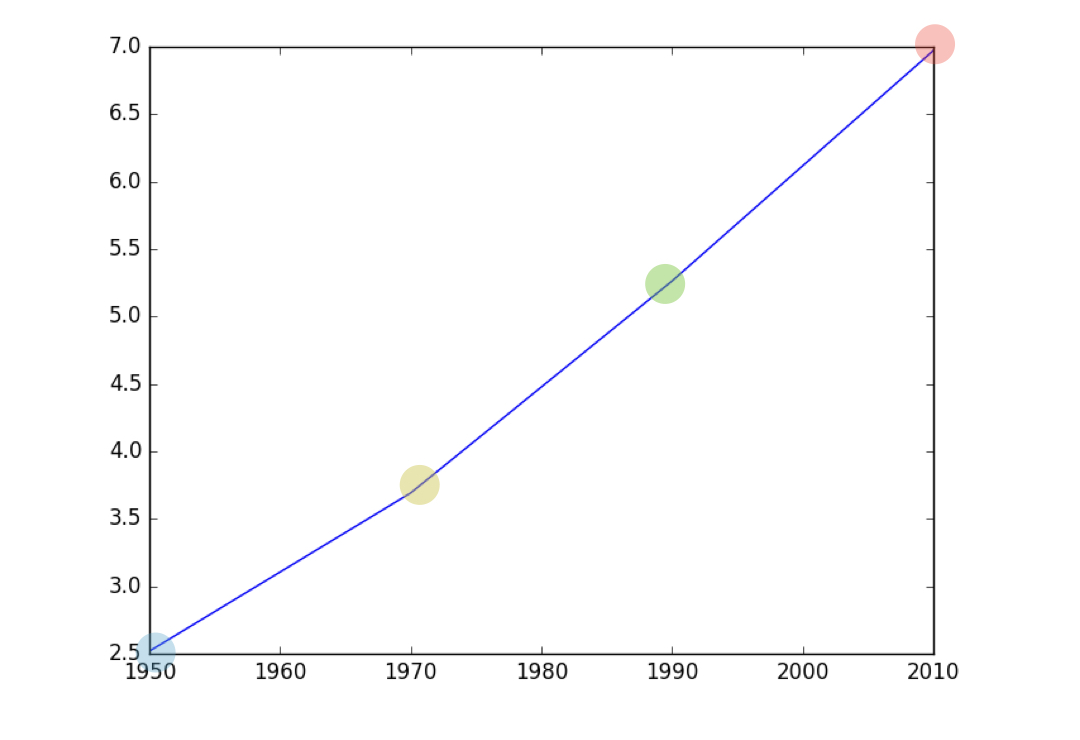
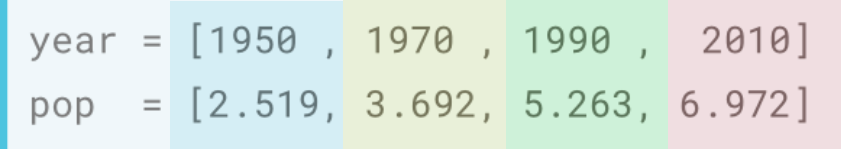
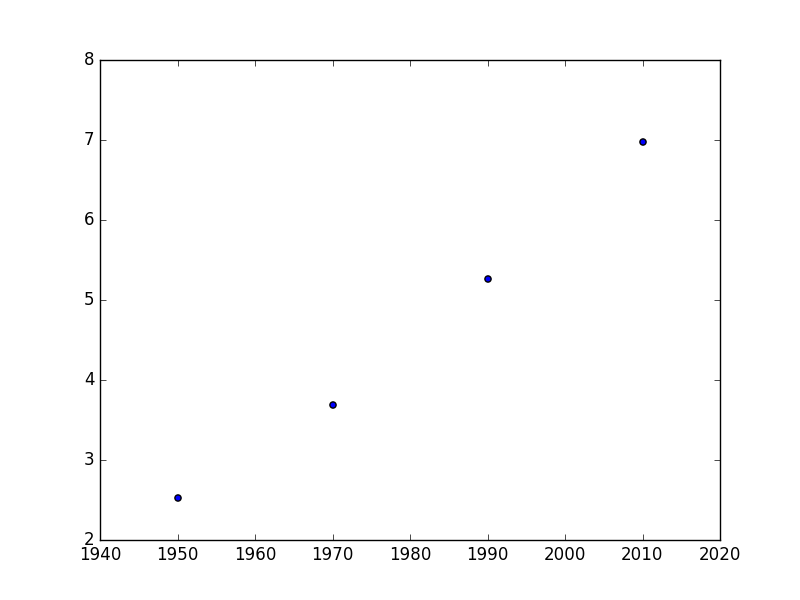
Gráfico de dispersão
import matplotlib.pyplot as plt
year = [1950, 1970, 1990, 2010]
pop = [2.519, 3.692, 5.263, 6.972]
plt.scatter(year, pop)
plt.show()