Visualização de dados
Manipulação de dados com o pandas

Maggie Matsui
Senior Content Developer at DataCamp
Histogramas
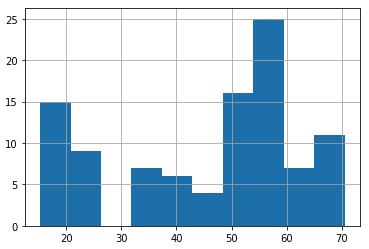
Histogramas
dog_pack["height_cm"].hist(bins=20)
plt.show()
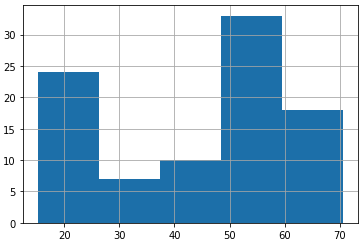
dog_pack["height_cm"].hist(bins=5)
plt.show()
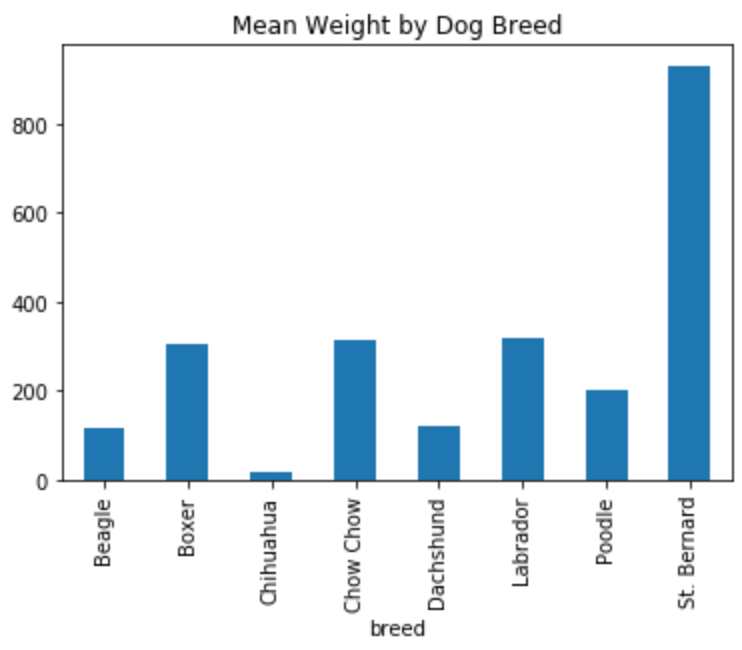
Gráficos de barras
avg_weight_by_breed.plot(kind="bar")plt.show()
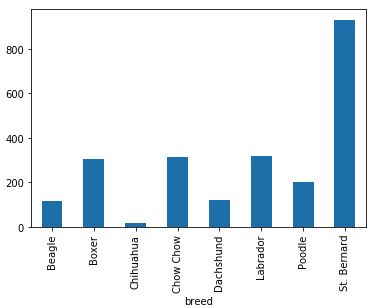
avg_weight_by_breed.plot(kind="bar",
    title="Mean Weight by Dog Breed")
plt.show()
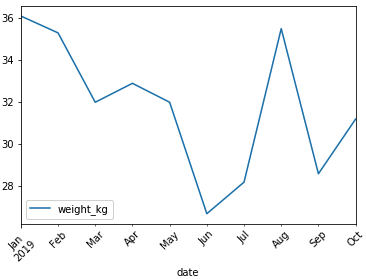
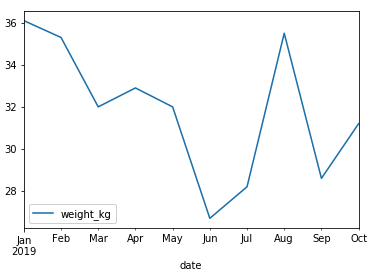
Rotação de rótulos de eixos
sully.plot(x="date", y="weight_kg", kind="line", rot=45)
plt.show()
 .
.
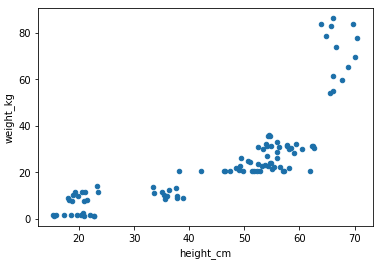
Gráficos de dispersão
dog_pack.plot(x="height_cm", y="weight_kg", kind="scatter")
plt.show()
Sobreposição de gráficos
dog_pack[dog_pack["sex"]=="F"]["height_cm"].hist() dog_pack[dog_pack["sex"]=="M"]["height_cm"].hist()plt.show()
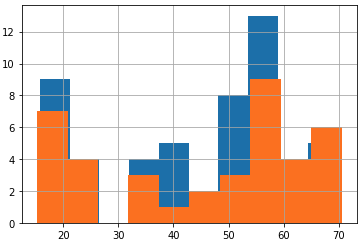
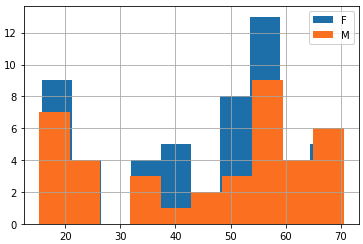
Acrescente uma legenda
dog_pack[dog_pack["sex"]=="F"]["height_cm"].hist()
dog_pack[dog_pack["sex"]=="M"]["height_cm"].hist()
plt.legend(["F", "M"])
plt.show()
 .
.
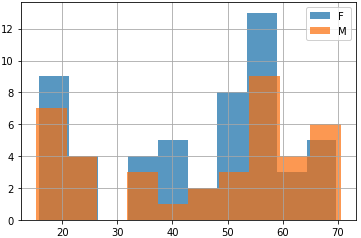
Transparência
dog_pack[dog_pack["sex"]=="F"]["height_cm"].hist(alpha=0.7)
dog_pack[dog_pack["sex"]=="M"]["height_cm"].hist(alpha=0.7)
plt.legend(["F", "M"])
plt.show()
 .
.

