Análise exploratória de dados
Introdução à ciência de dados

Hadrien Lacroix
Content Developer at DataCamp
O que é EDA?
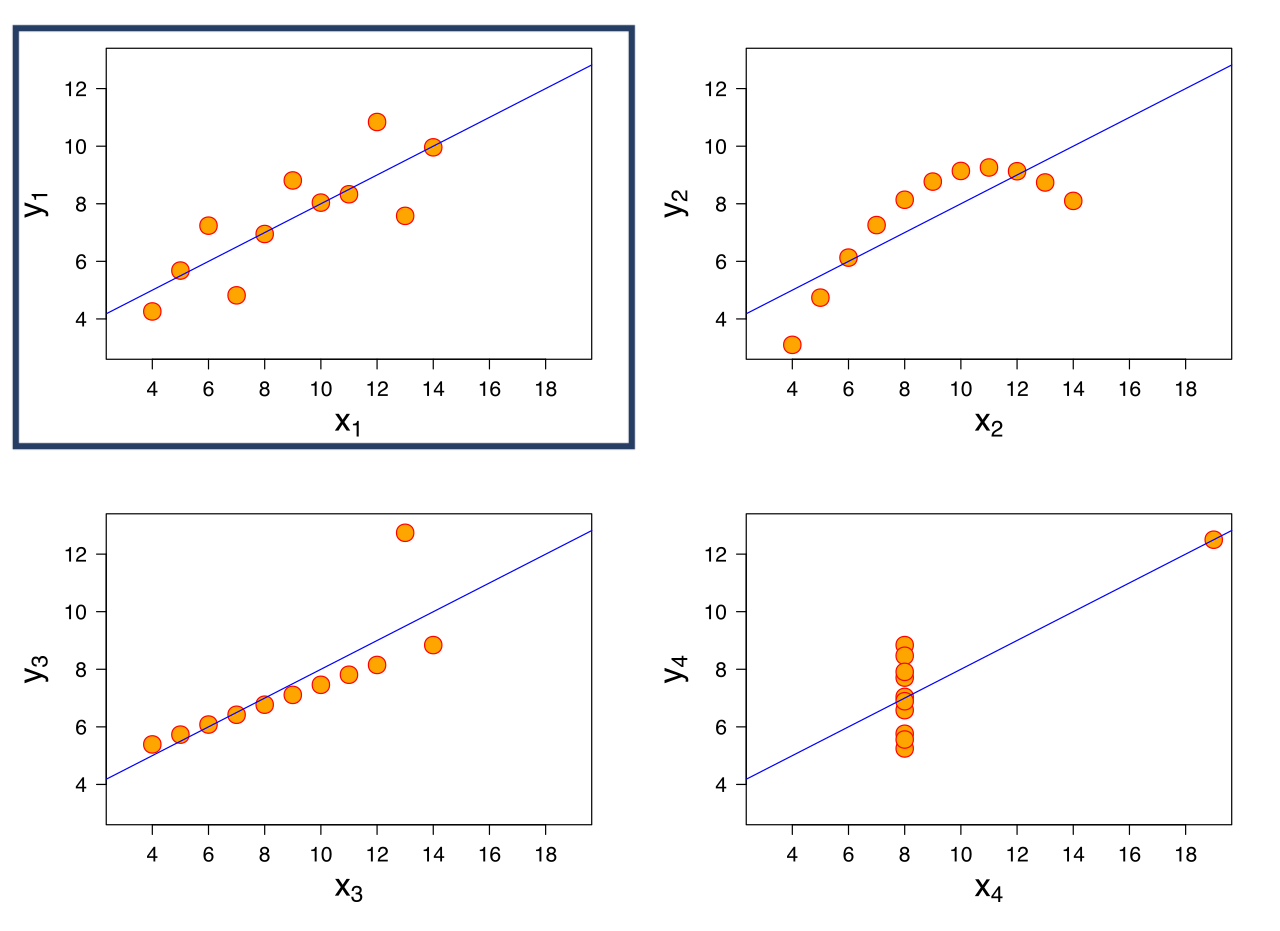
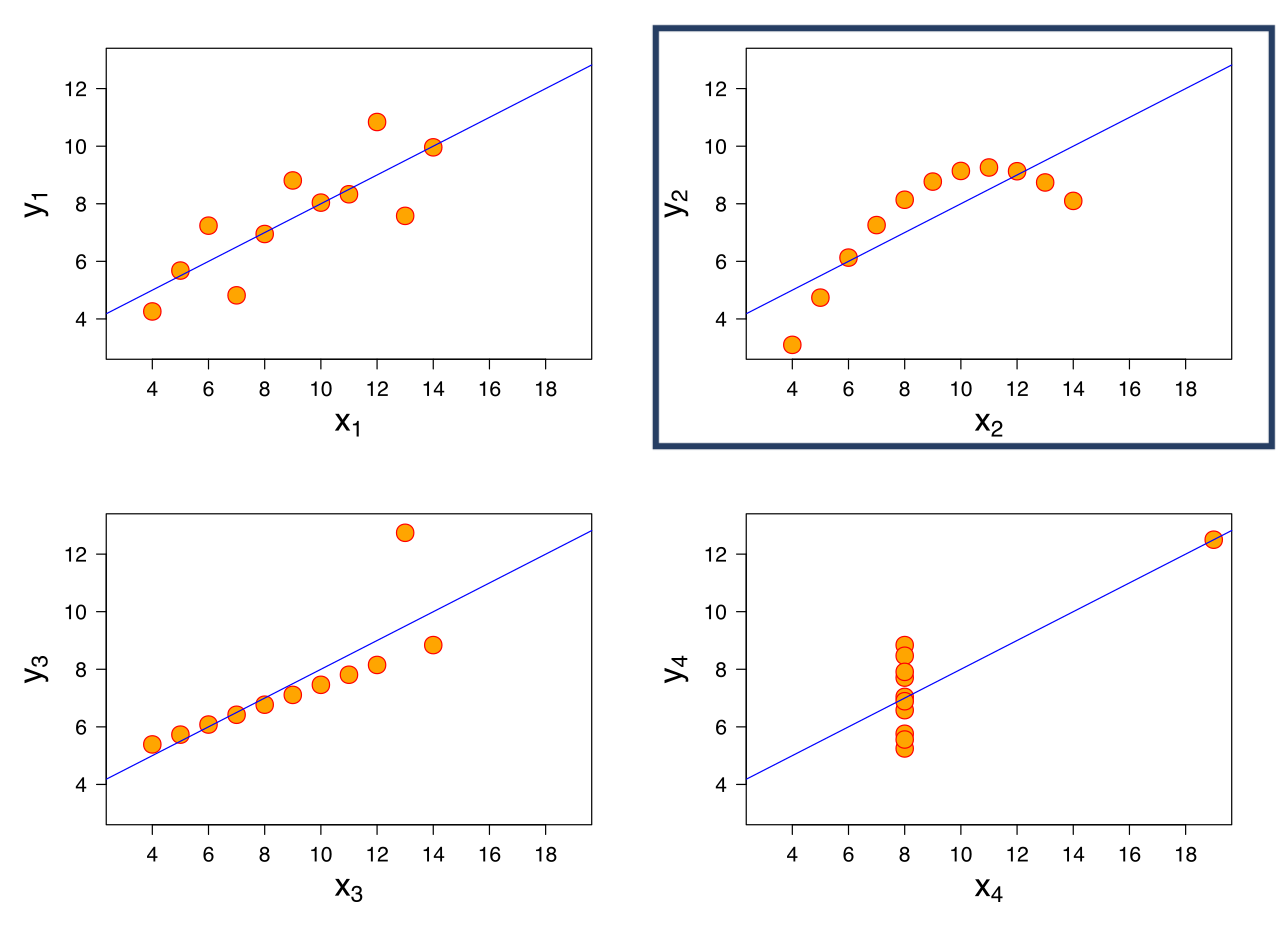
O quarteto de Anscombe
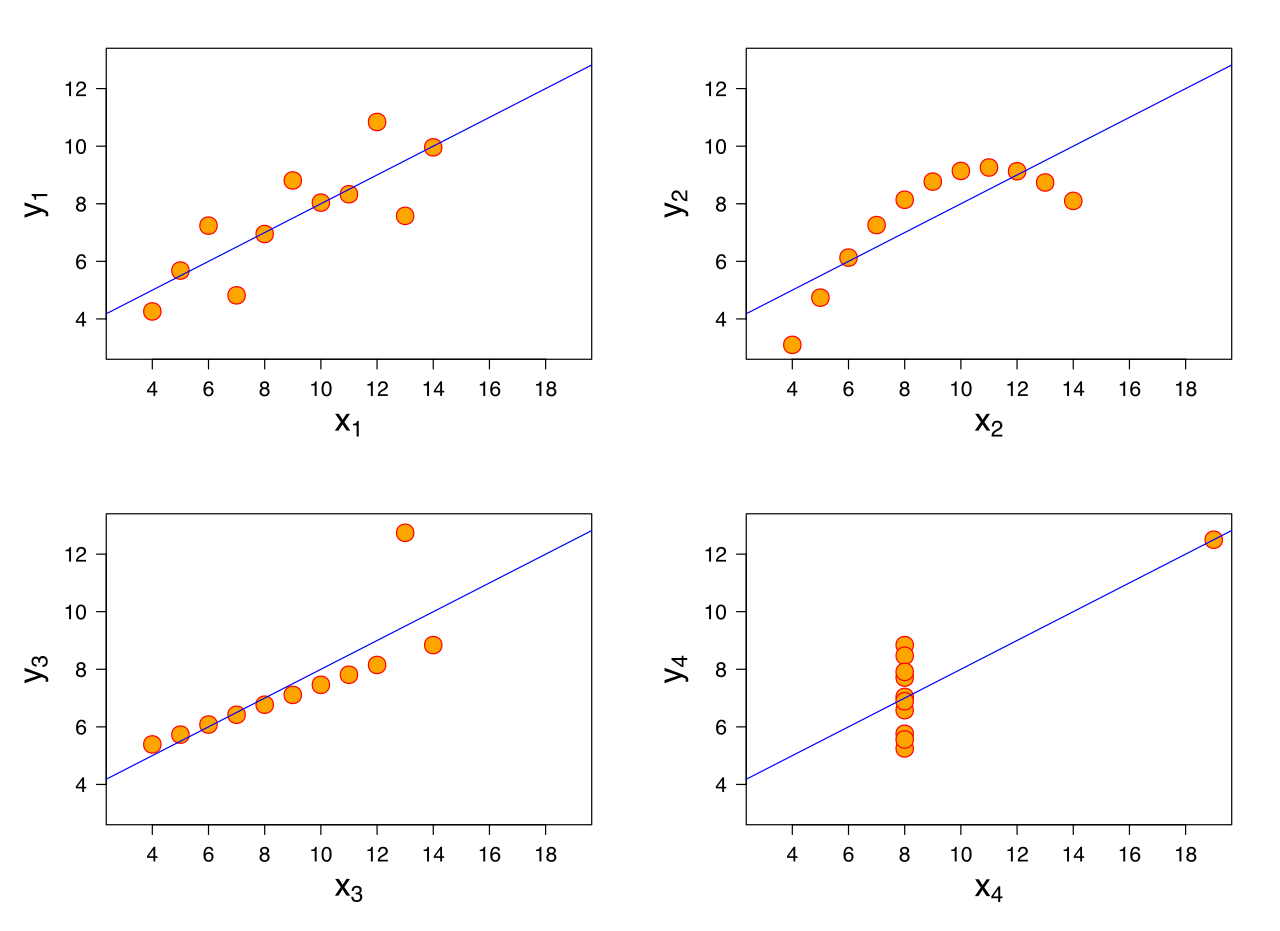
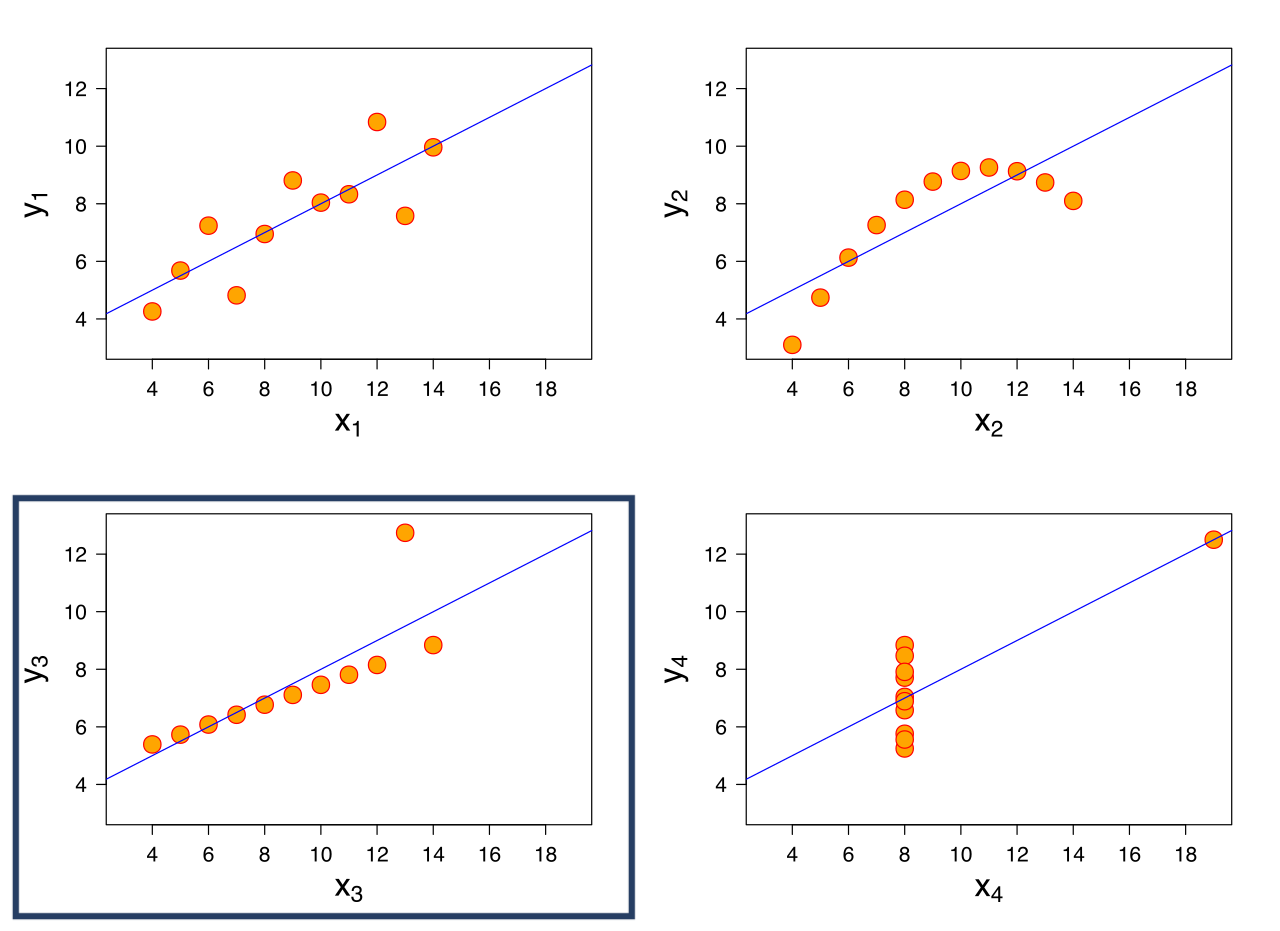
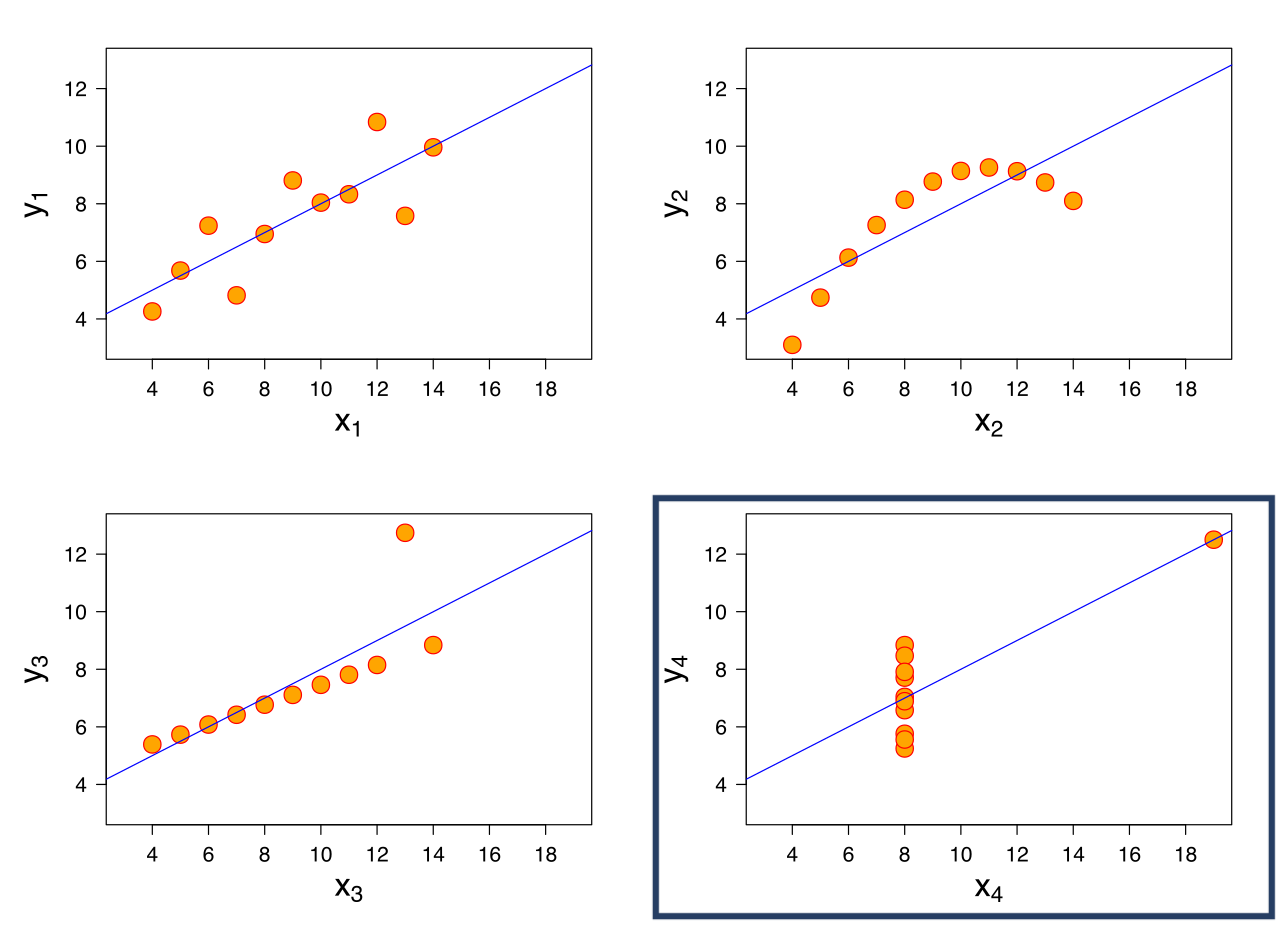

Visualize!
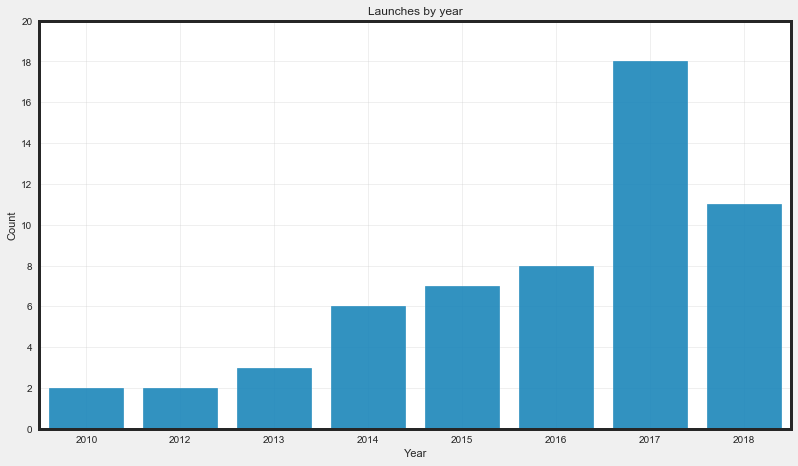
Faça mais perguntas!
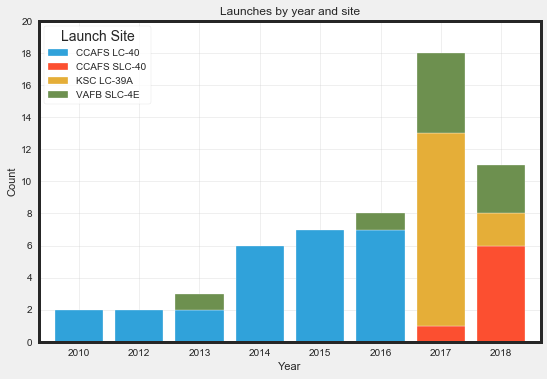
Faça mais perguntas!
Discrepâncias
Introdução à ciência de dados
Hadrien Lacroix
Content Developer at DataCamp

