Dashboards e stories
Introdução ao Tableau
Carl Rosseel
Head of BI Curriculum at DataCamp
Dashboards
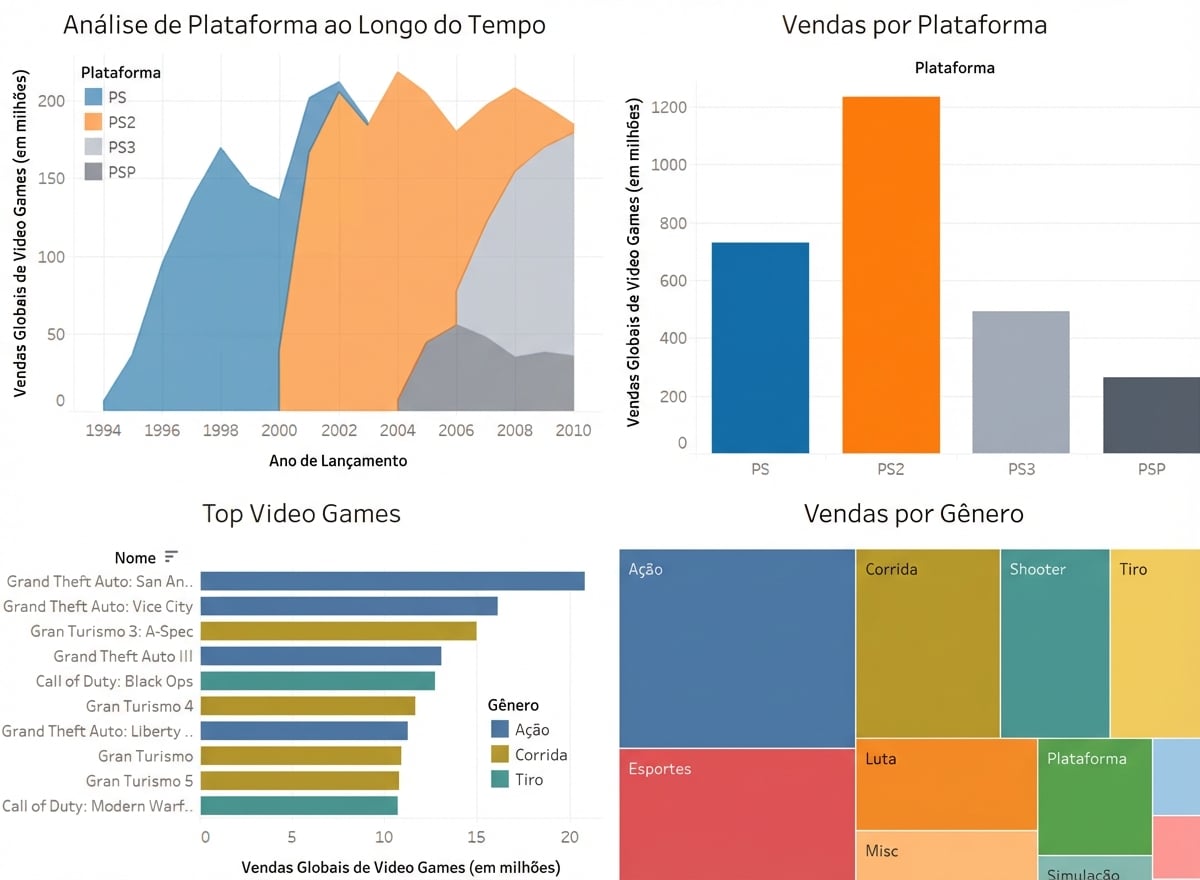
Dashboard
Conjunto de várias visualizações
Facilita comparar dados
Ajuda a revelar insights-chave
Dados se conectam automaticamente às suas planilhas
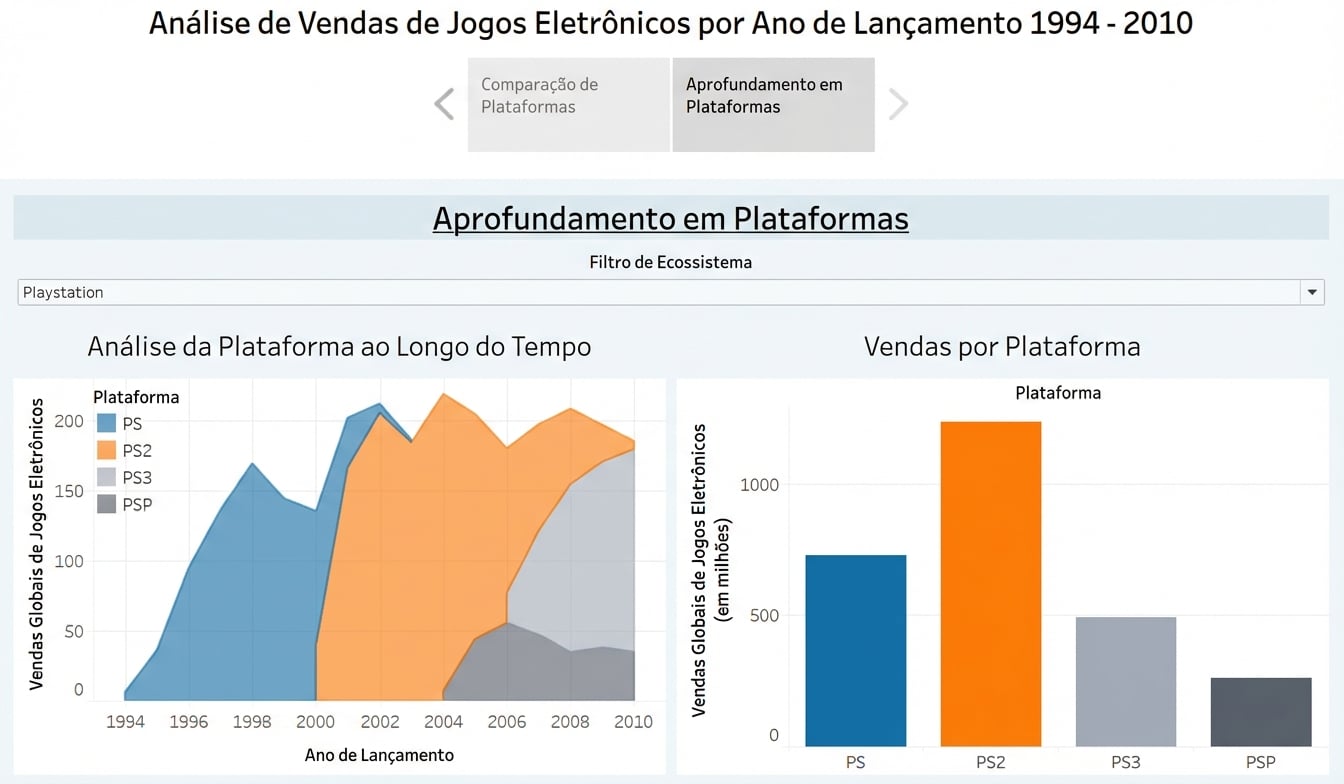
Dashboards avançados permitem drill down e análise própria
Visualizações podem ser ligadas; uma vira filtro interativo
Stories
Insights úteis de dashboard/planilha
Sequência de visualizações para contar uma narrativa
Cada visualização é um story point
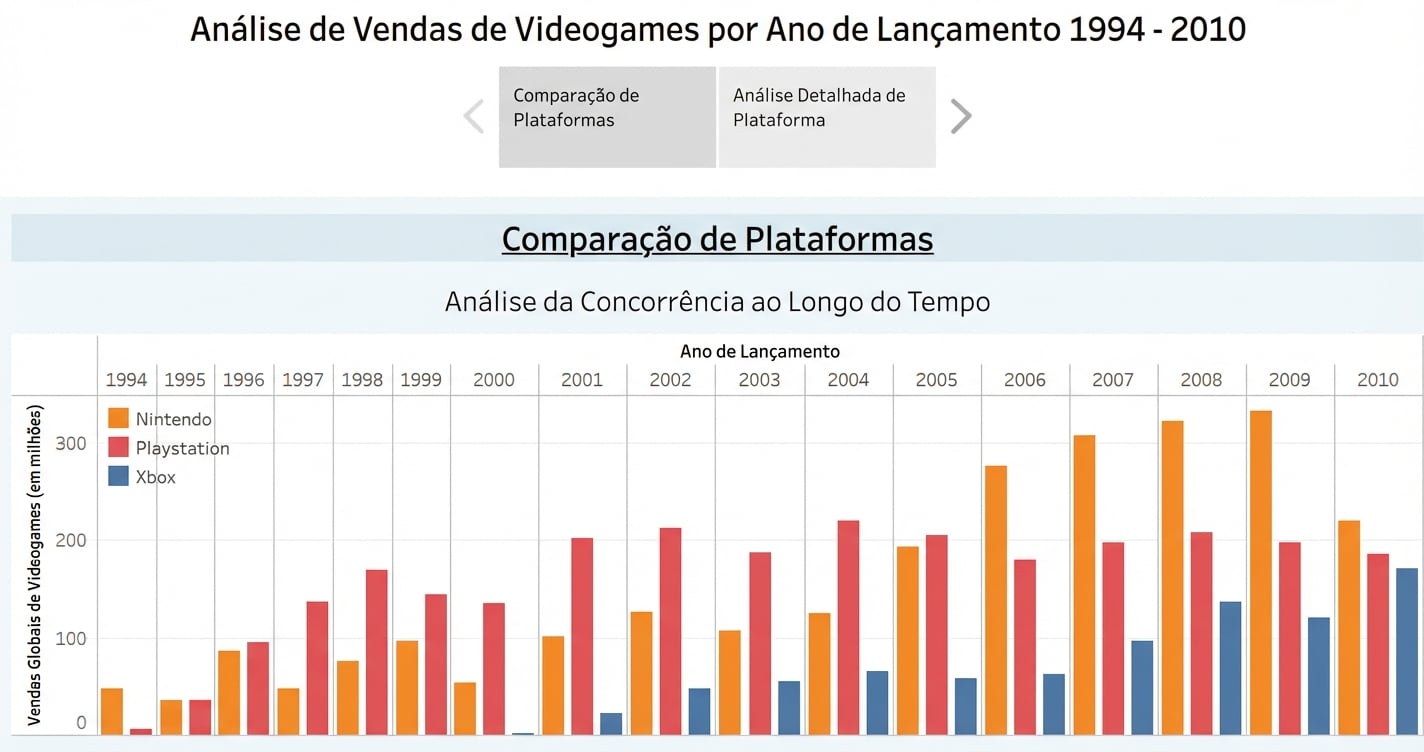
Stories
Stories
Como tudo se encaixa?
Vamos praticar!
Introdução ao Tableau
Preparing Video For Download...