Introdução à regressão
Aprendizado Supervisionado com scikit-learn

George Boorman
Core Curriculum Manager, DataCamp
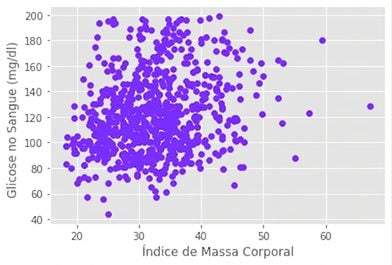
Gráfico de glicose x índice de massa corporal
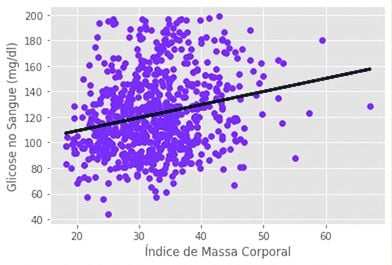
Ajuste de um modelo de regressão
Aprendizado Supervisionado com scikit-learn
George Boorman
Core Curriculum Manager, DataCamp

