O que é uma função?
Introdução à Ciência de Dados em Python

Hillary Green-Lerman
Lead Data Scientist, Looker
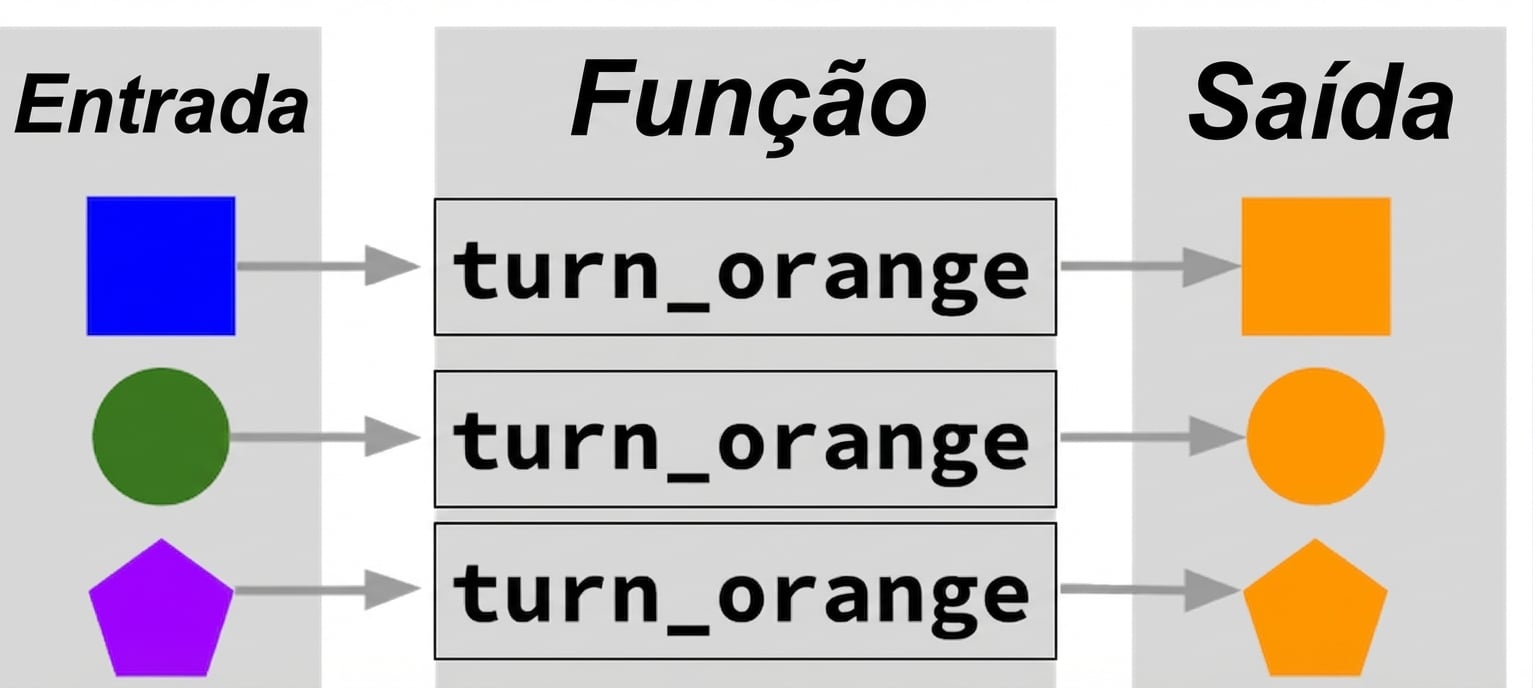
Uma função é uma ação
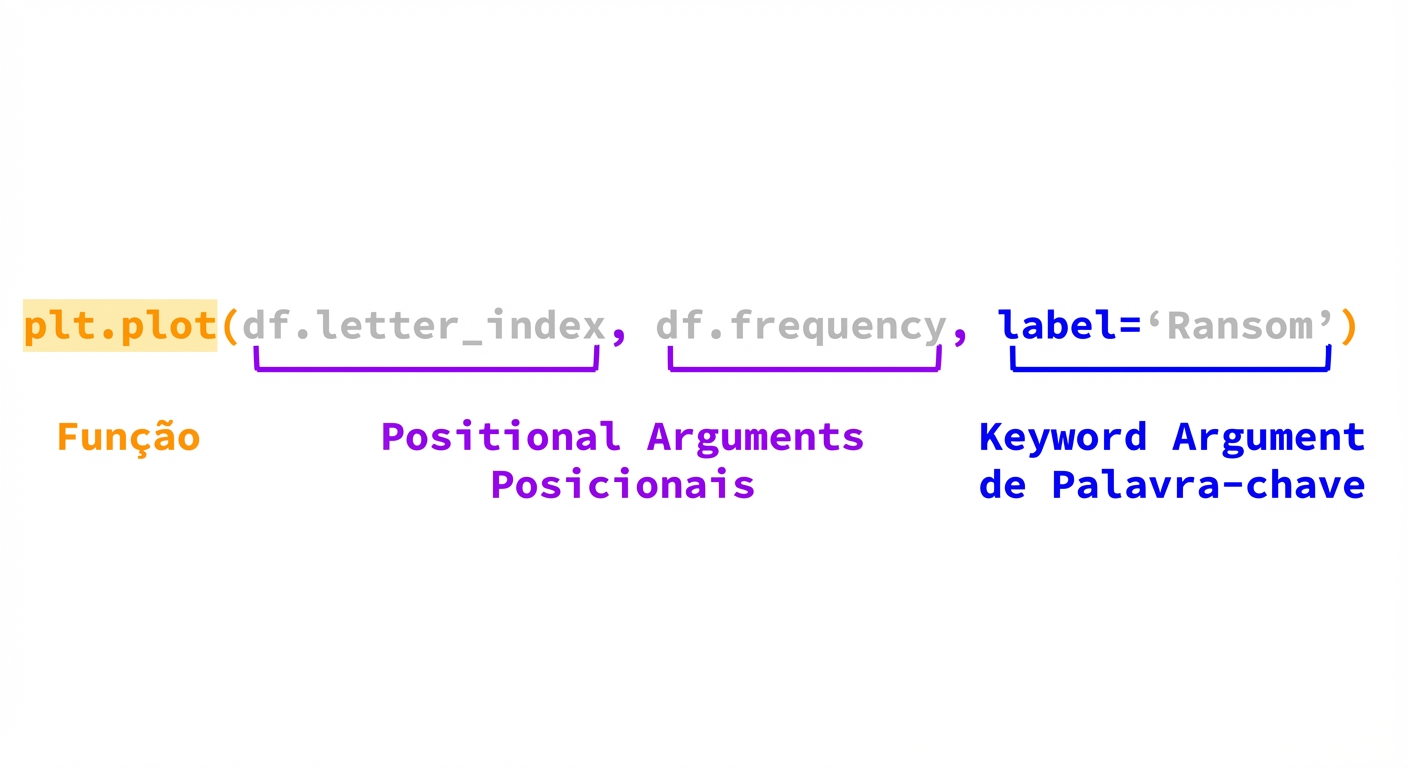
Anatomia de uma função: nome da função
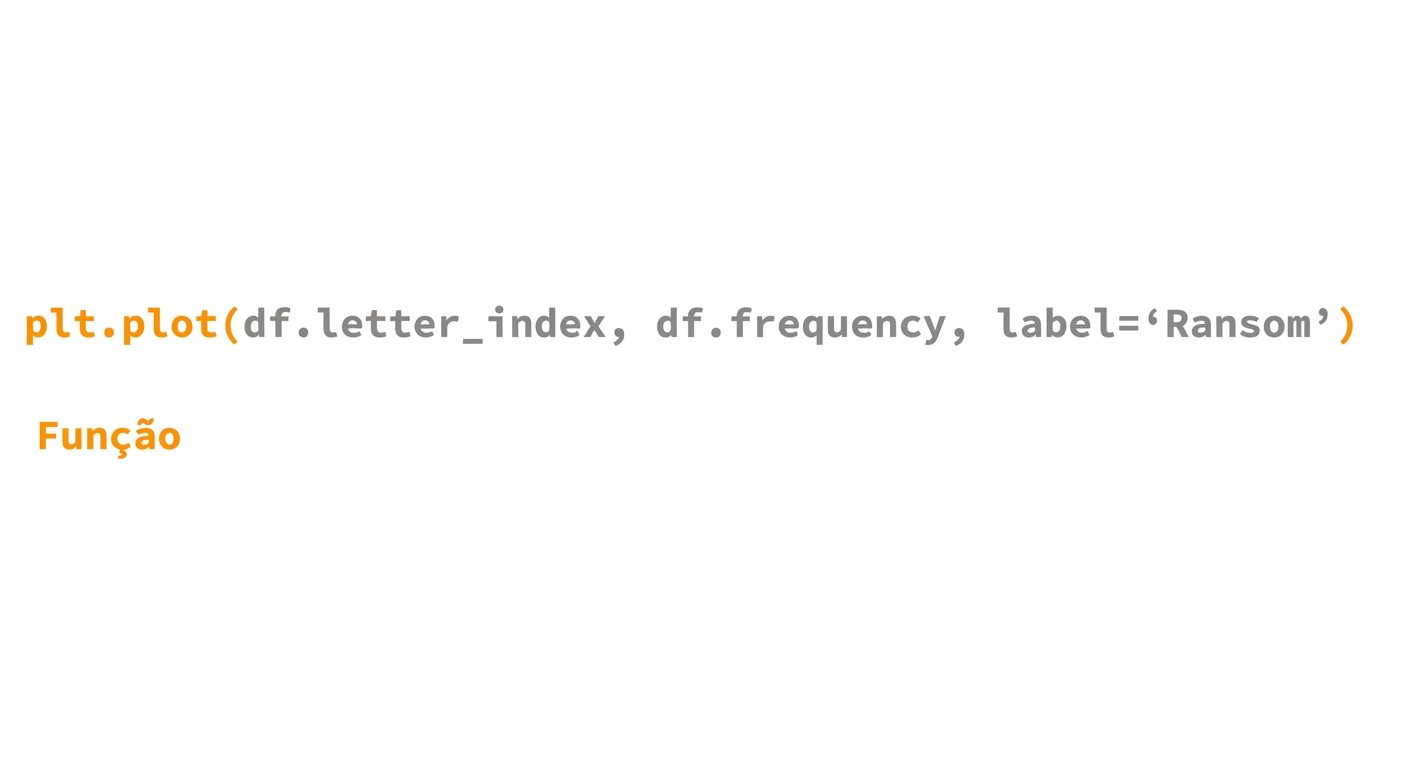
Nome da função:
- Começa com o módulo onde ela “mora” (
plt) - Depois vem o nome da função (
plot) - O nome da função é sempre seguido por parênteses
()
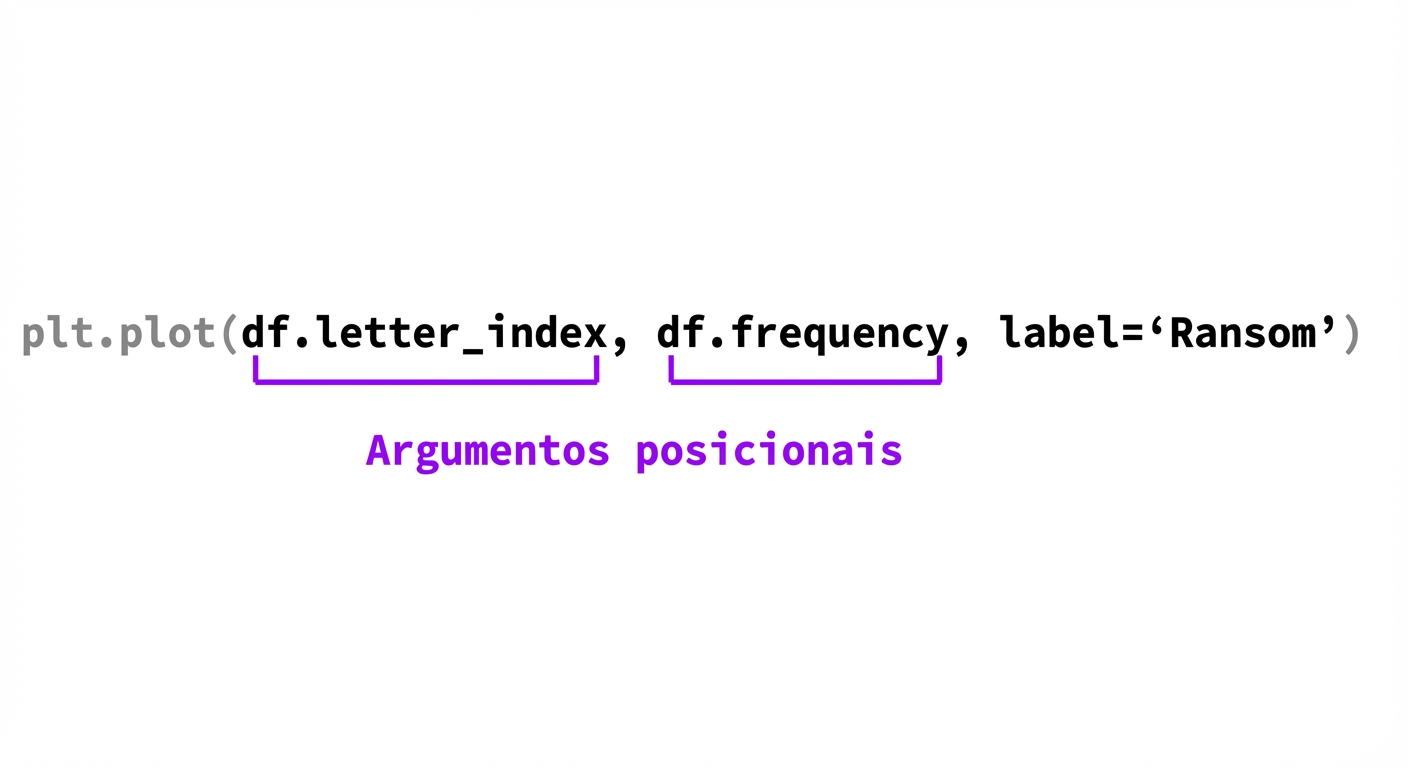
Anatomia de uma função: argumentos posicionais
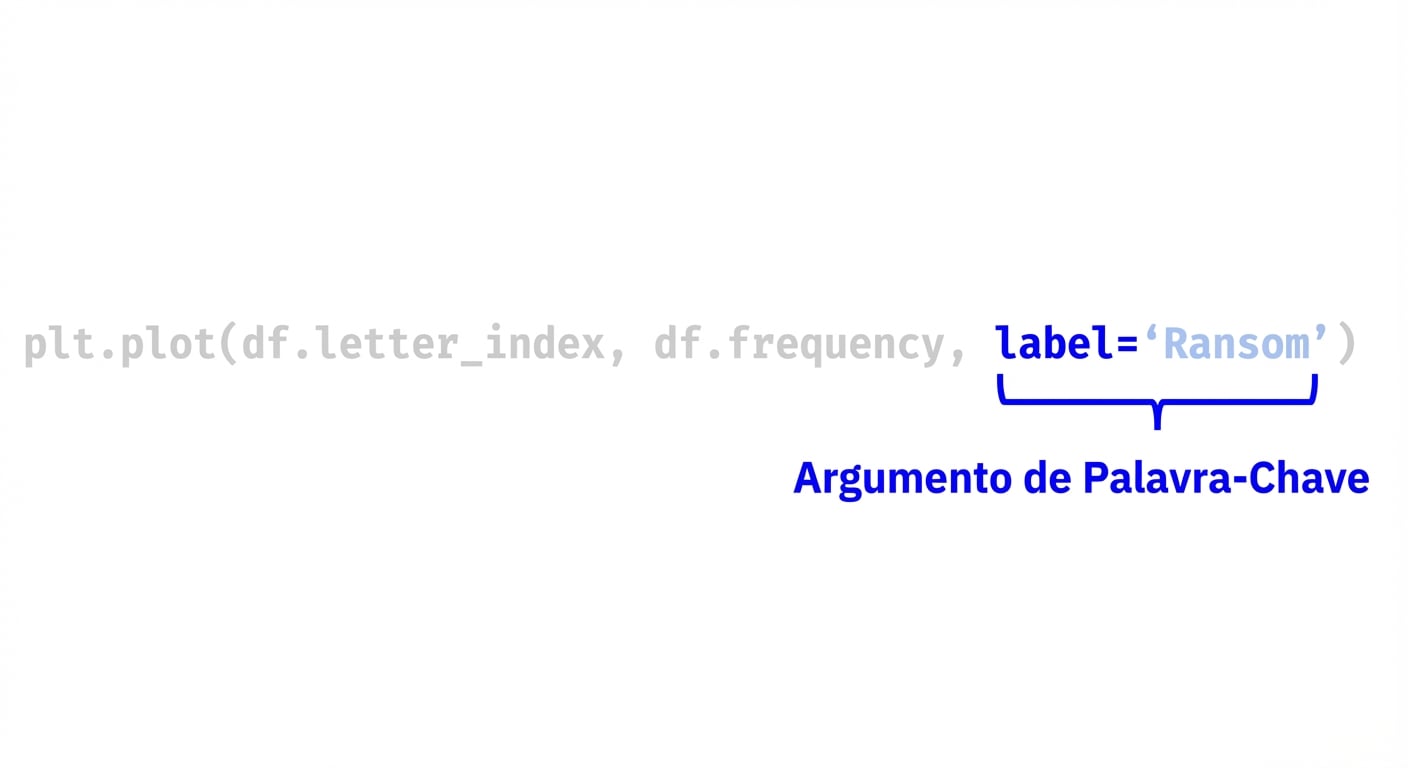
Anatomia de uma função: argumentos nomeados
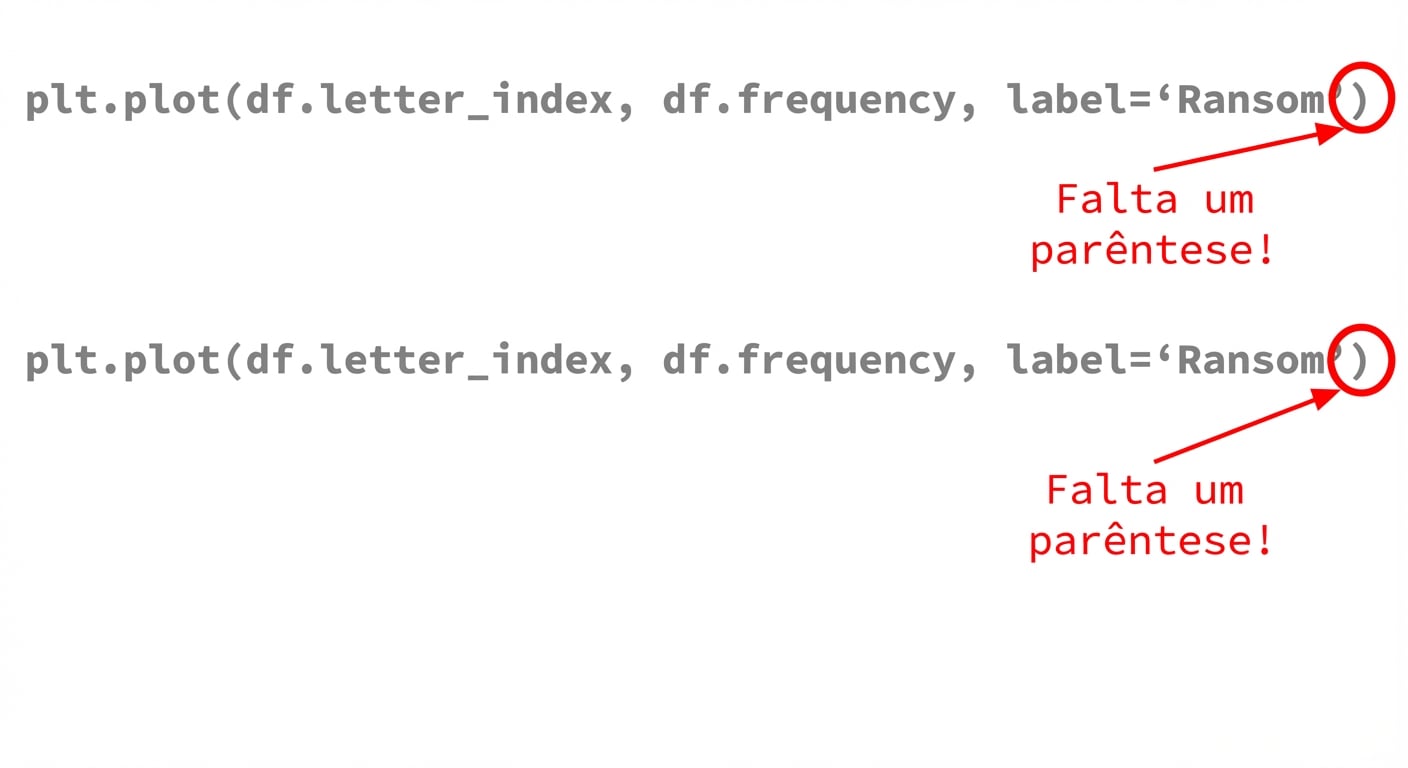
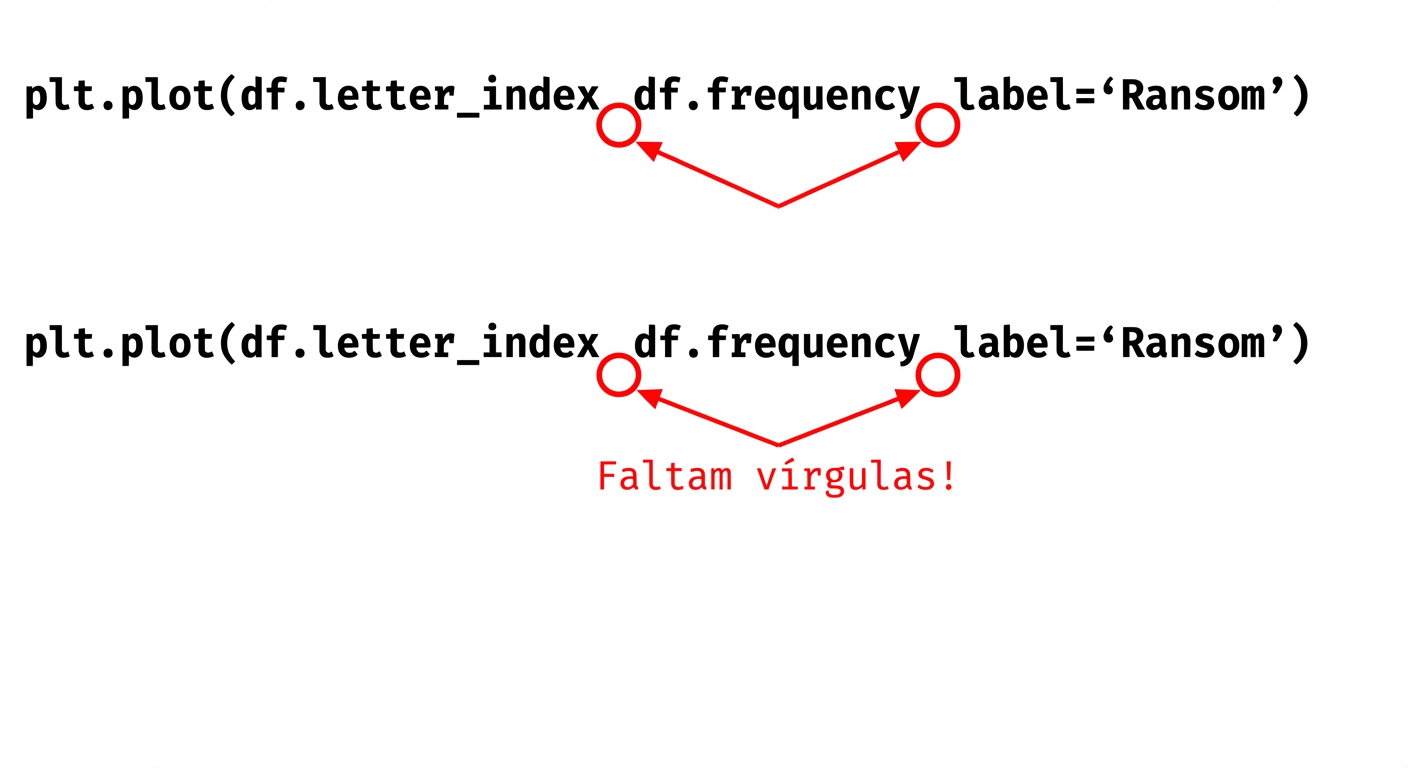
Erros comuns em funções
- Vírgulas faltando entre argumentos
- Parêntese de fechamento ausente