Data summarization

Exploratory Data Analysis in Python

Izzy Weber

Curriculum Manager, DataCamp

Exploring groups of data

  • .groupby() groups data by category
  • Aggregating function indicates how to summarize grouped data


books.groupby("genre").mean()
|       genre |   rating |        year |
|-------------|----------|-------------|
|   Childrens | 4.780000 | 2015.075000 |
|     Fiction | 4.570229 | 2013.022901 |
| Non Fiction | 4.598324 | 2013.513966 |
Exploratory Data Analysis in Python

Aggregating functions

  • Sum: .sum()
  • Count: .count()
  • Minimum: .min()
  • Maximum: .max()
  • Variance: .var()
  • Standard deviation: .std()
Exploratory Data Analysis in Python

Aggregating ungrouped data

  • .agg() applies aggregating functions across a DataFrame


books.agg(["mean", "std"])
|      |   rating |        year |
|------|----------|-------------|
| mean | 4.608571 | 2013.508571 |
|  std | 0.226941 |     3.28471 |
Exploratory Data Analysis in Python

Specifying aggregations for columns

books.agg({"rating": ["mean", "std"], "year": ["median"]})
|        |   rating |   year |
|--------|----------|--------|
|   mean | 4.608571 |    NaN |
|    std | 0.226941 |    NaN |
| median |      NaN | 2013.0 |
Exploratory Data Analysis in Python

Named summary columns

books.groupby("genre").agg(
    mean_rating=("rating", "mean"),
    std_rating=("rating", "std"),
    median_year=("year", "median")
)
|  genre      | mean_rating | std_rating | median_year |
|-------------|-------------|------------|-------------|
|   Childrens |    4.780000 |   0.122370 |      2015.0 |
|     Fiction |    4.570229 |   0.281123 |      2013.0 |
| Non Fiction |    4.598324 |   0.179411 |      2013.0 |
Exploratory Data Analysis in Python

Visualizing categorical summaries

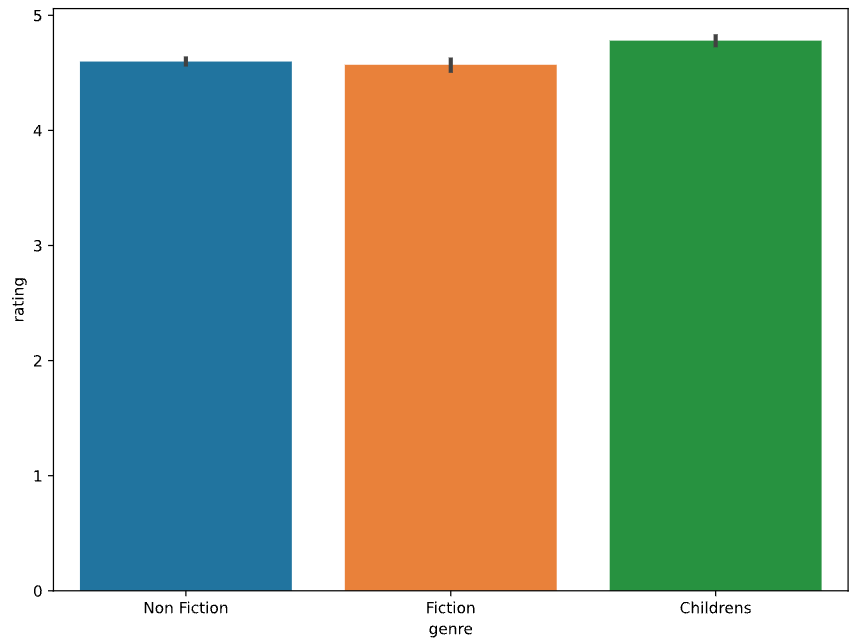
sns.barplot(data=books, x="genre", y="rating")
plt.show()

a barplot of book genres and their average ratings

Exploratory Data Analysis in Python

Let's practice!

Exploratory Data Analysis in Python

Preparing Video For Download...