Análise exploratória inicial
Análise Exploratória de Dados em Python

Izzy Weber
Curriculum Manager, DataCamp
Análise exploratória de dados

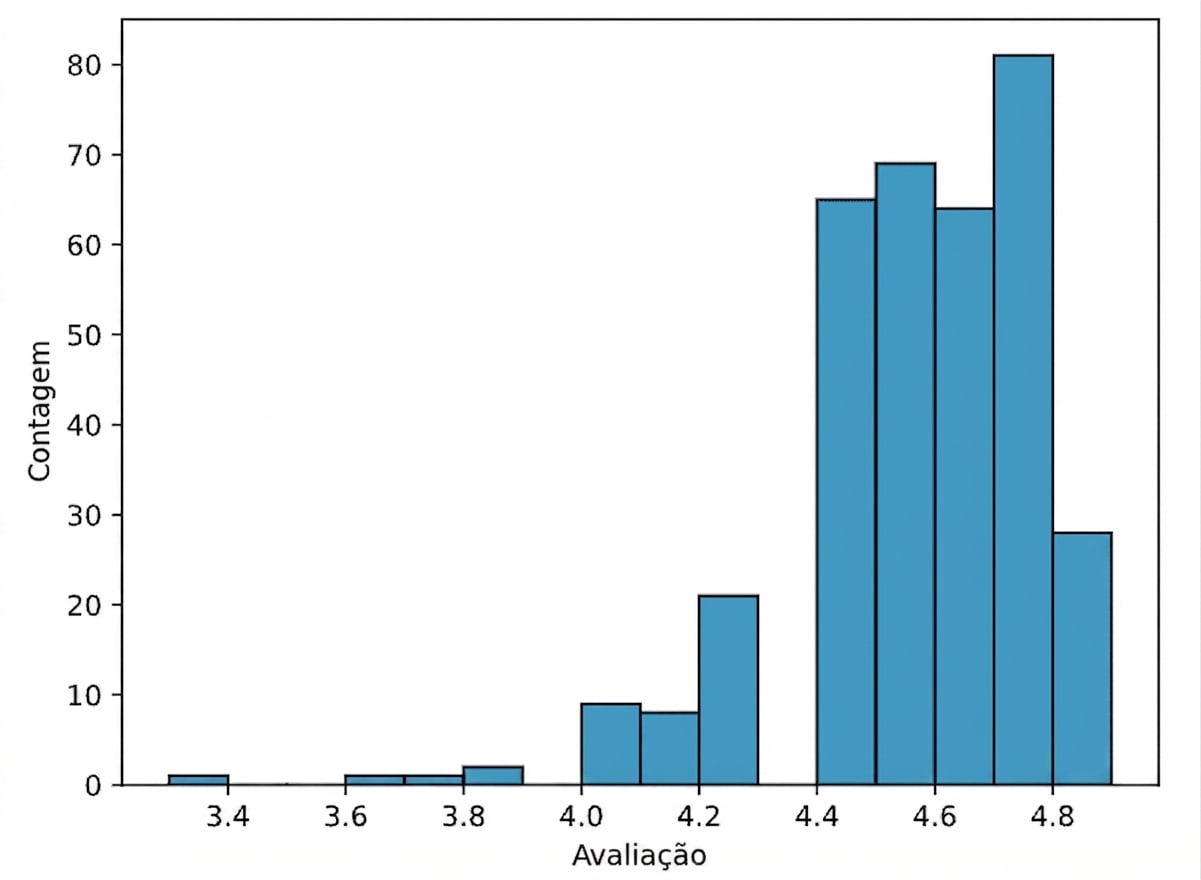
Visualizar dados numéricos
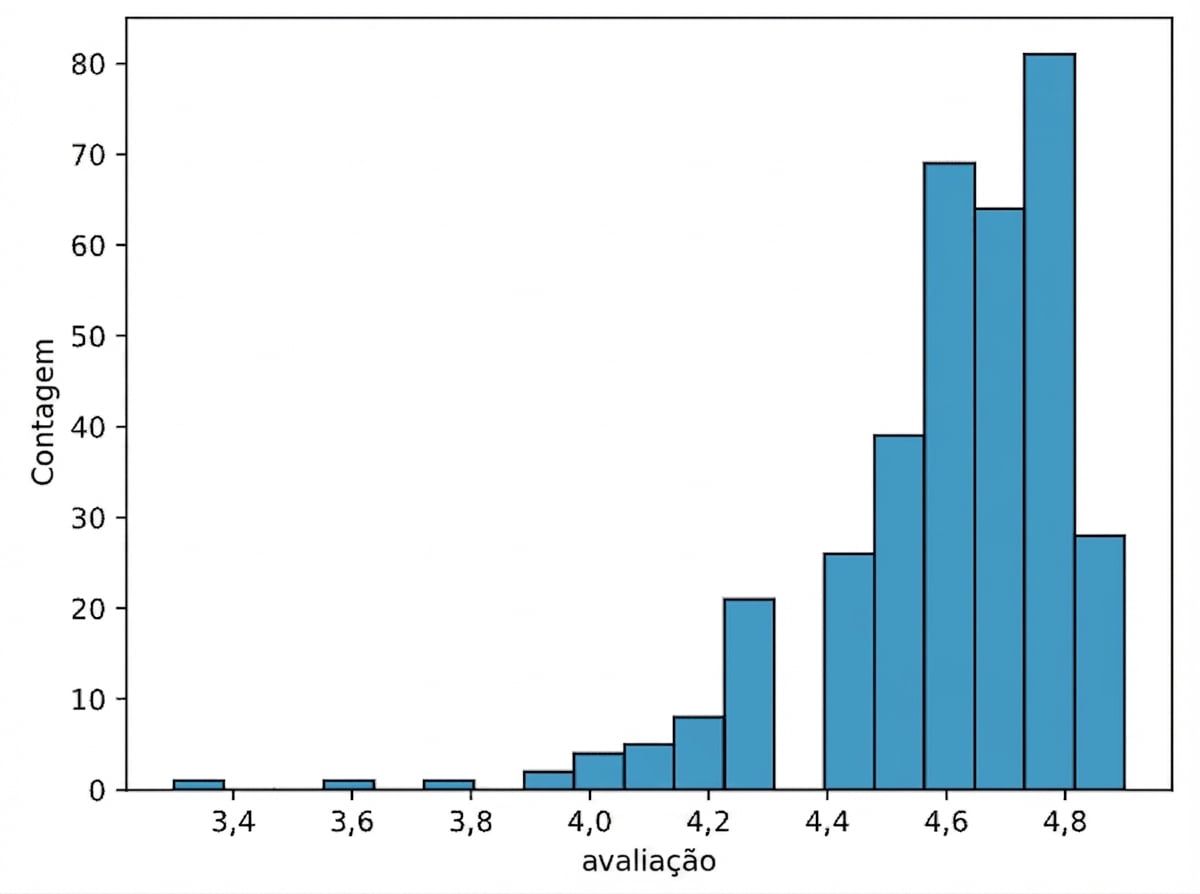
Ajustar largura do intervalo
sns.histplot(data=books, x="rating", binwidth=.1)
plt.show()