Tratamento de valores discrepantes
Análise Exploratória de Dados em Python

George Boorman
Curriculum Manager, DataCamp
O que é uma discrepância?

1 Crédito da imagem: https://unsplash.com/@ralphkayden
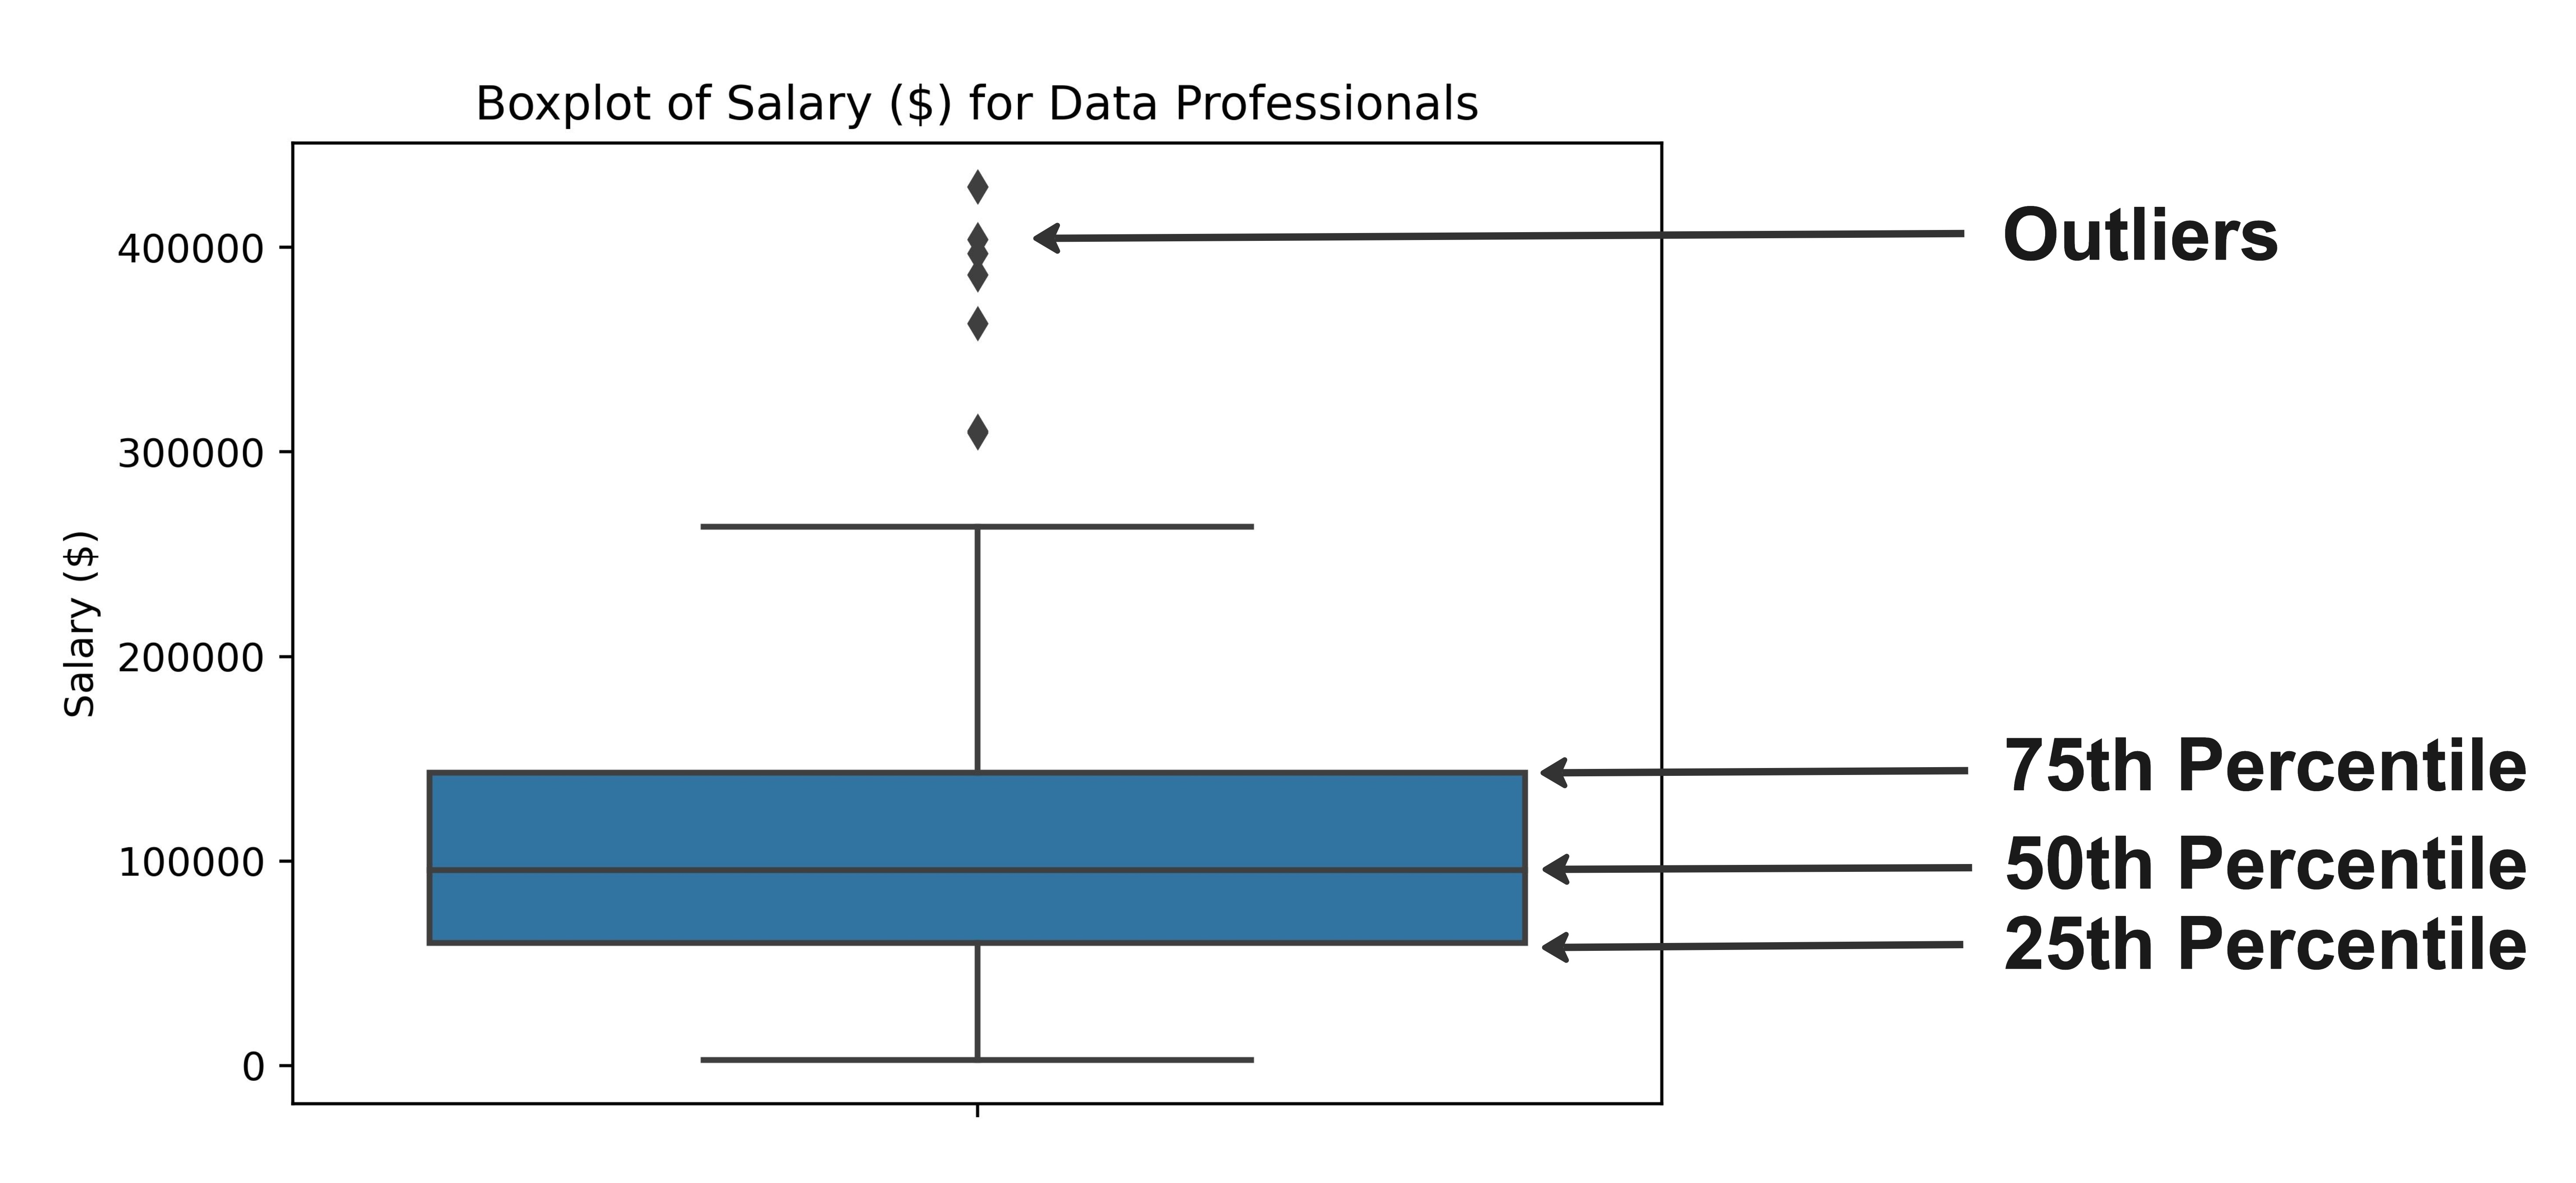
IQR em diagramas de caixa
sns.boxplot(data=salaries,
            y="Salary_USD")
plt.show()
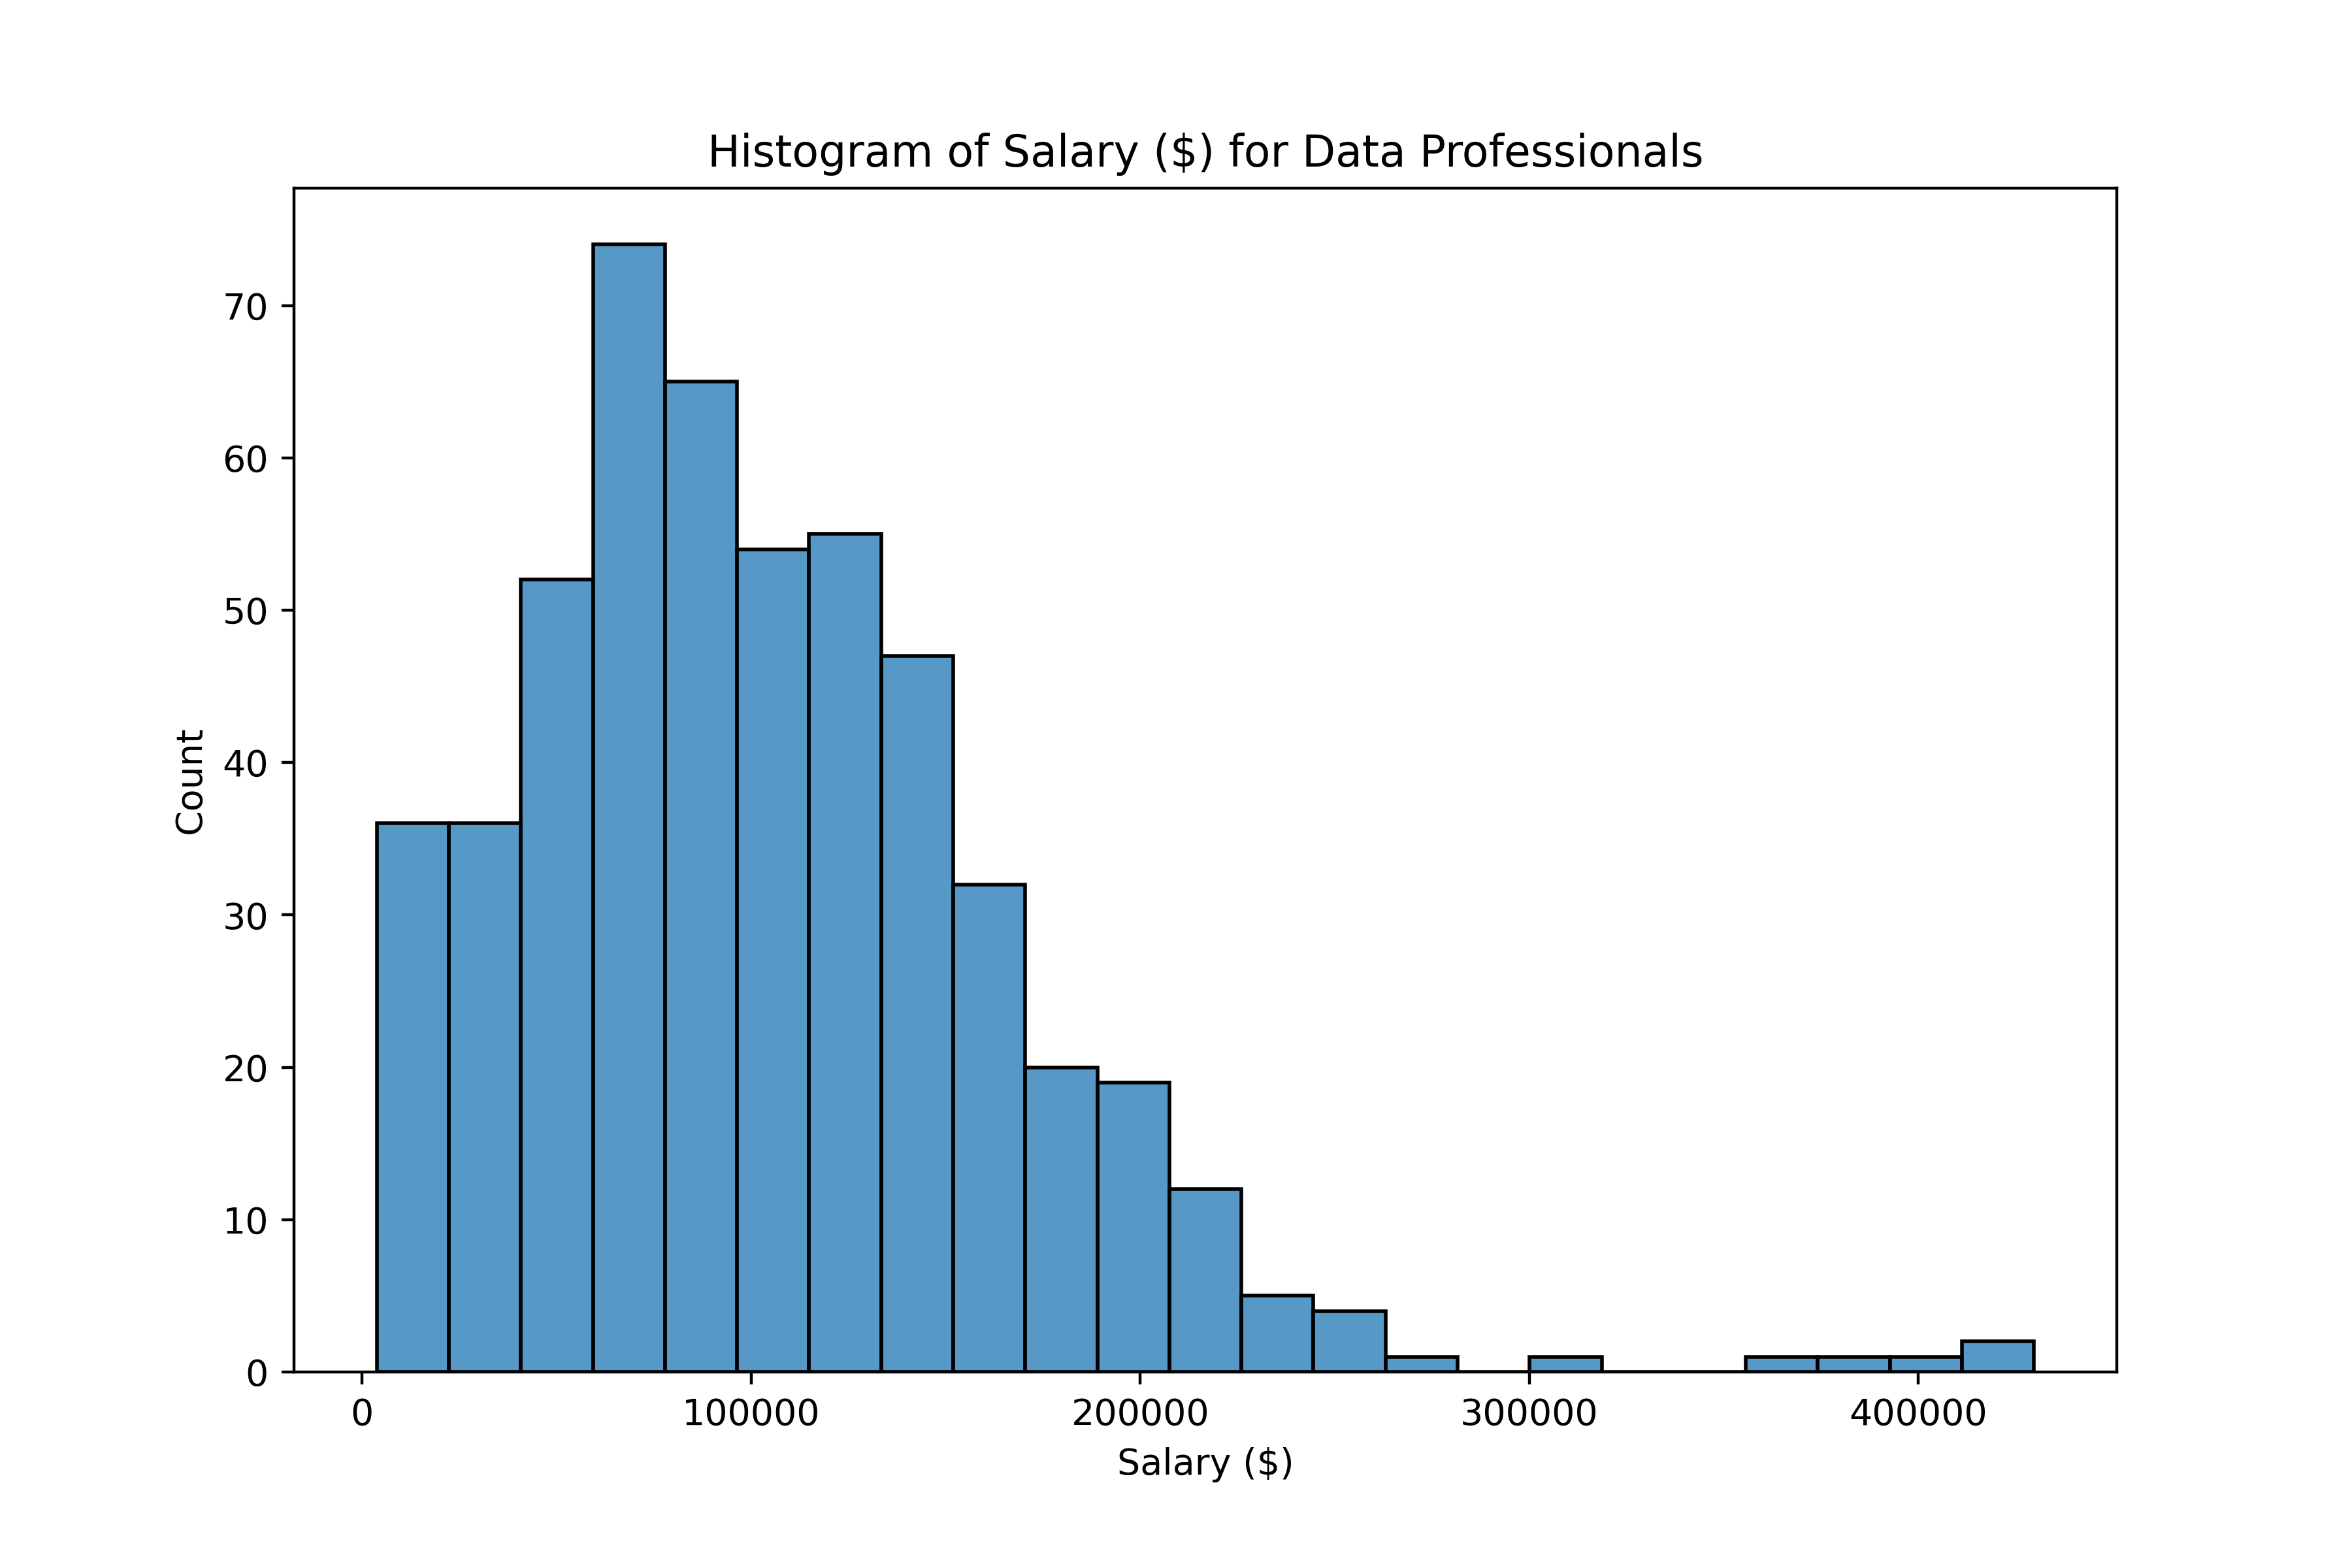
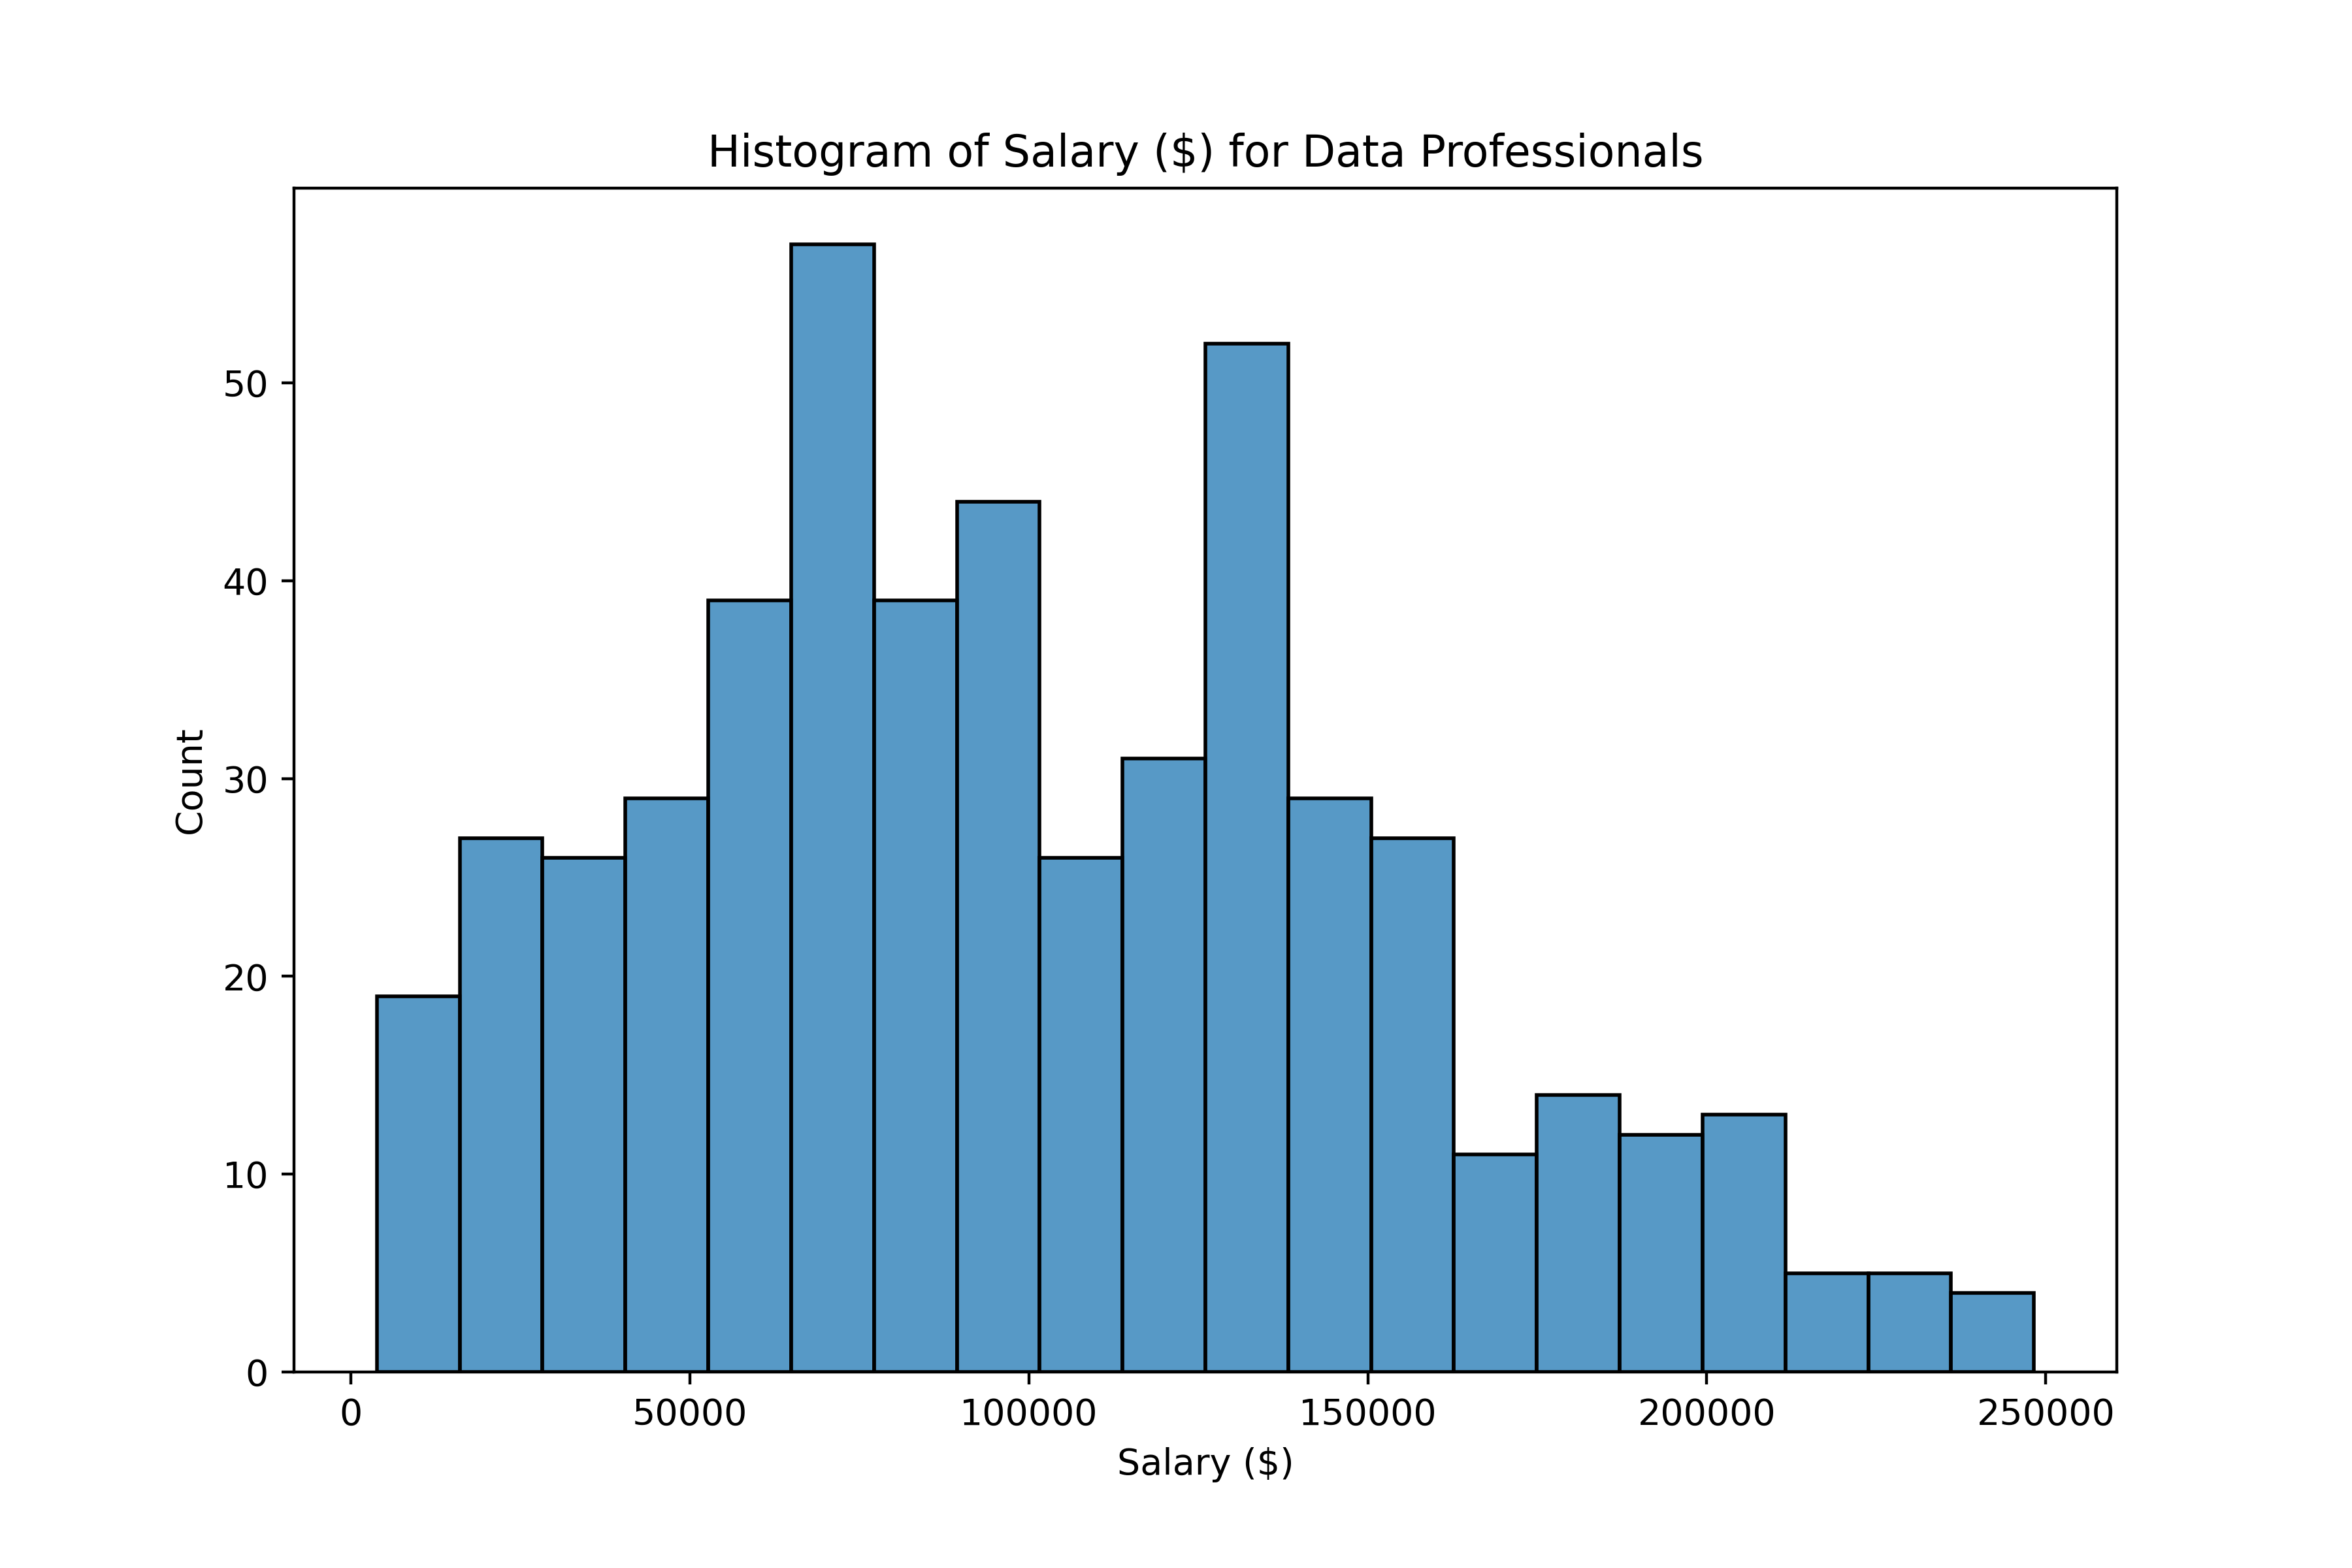
Distribuição de salários