Relações e distribuições de fatores
Análise Exploratória de Dados em Python

Izzy Weber
Curriculum Manager, DataCamp
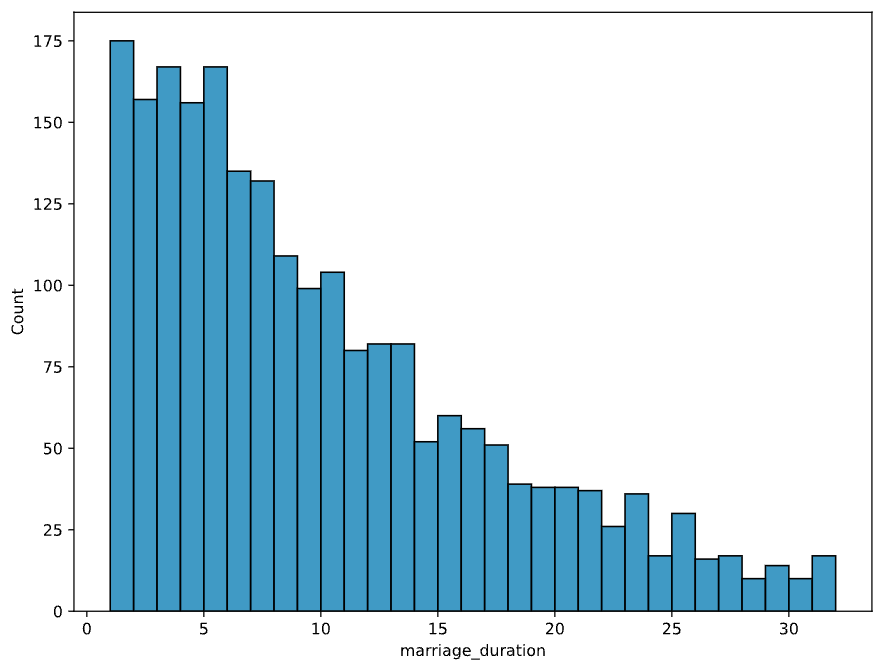
Explorar relações categóricas
sns.histplot(data=divorce, x="marriage_duration", binwidth=1)
plt.show()
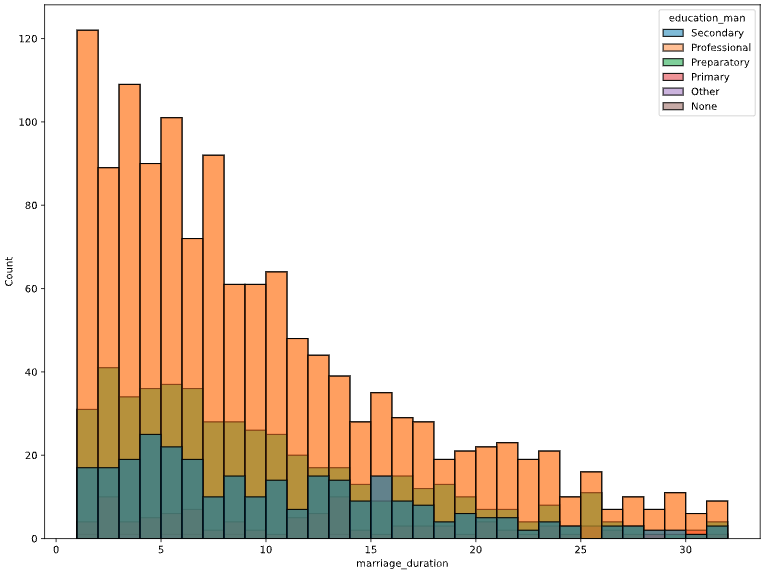
Explorar relações categóricas
sns.histplot(data=divorce, x="marriage_duration", hue="education_man", binwidth=1)
plt.show()
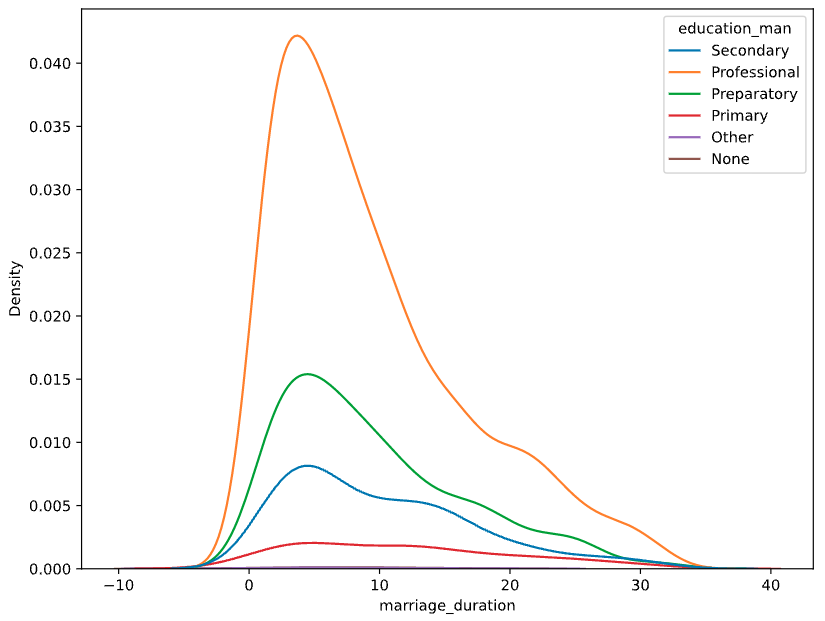
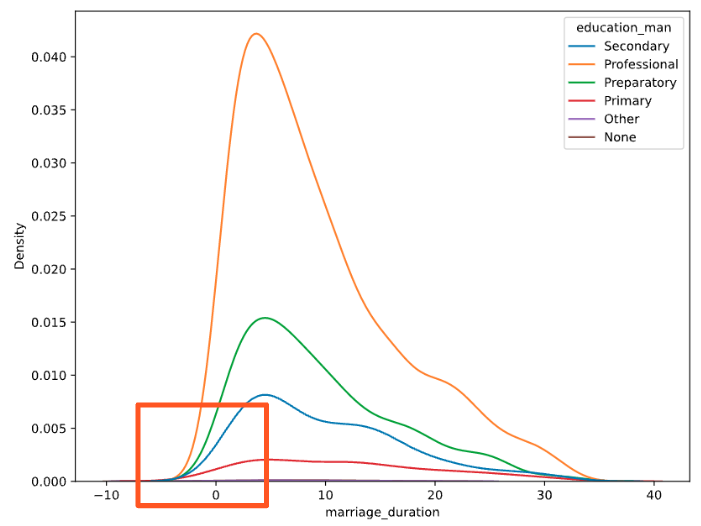
Gráficos de estimativa de densidade por kernel (KDE)
sns.kdeplot(data=divorce, x="marriage_duration", hue="education_man")
plt.show()
Gráficos de estimativa de densidade por kernel (KDE)
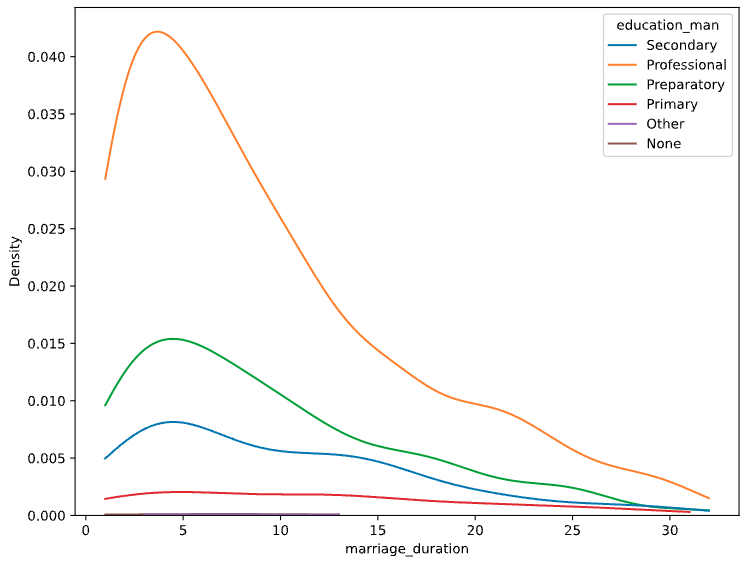
Gráficos de estimativa de densidade por kernel (KDE)
sns.kdeplot(data=divorce, x="marriage_duration", hue="education_man", cut=0)
plt.show()
Gráficos de densidade cumulativa (KDE)
sns.kdeplot(data=divorce, x="marriage_duration", hue="education_man", cut=0, cumulative=True)
plt.show()
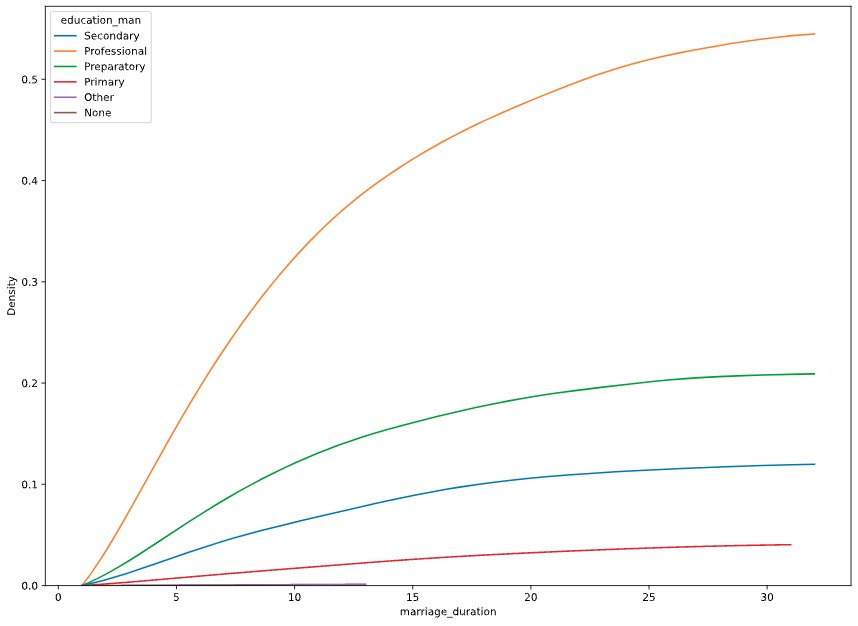
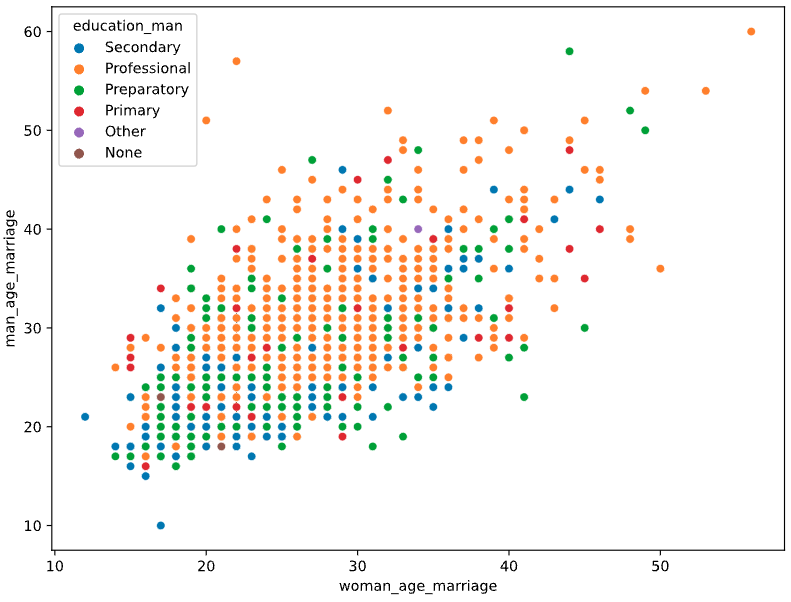
Gráfico de dispersão com variáveis categóricas
sns.scatterplot(data=divorce, x="woman_age_marriage", y="man_age_marriage")
plt.show()
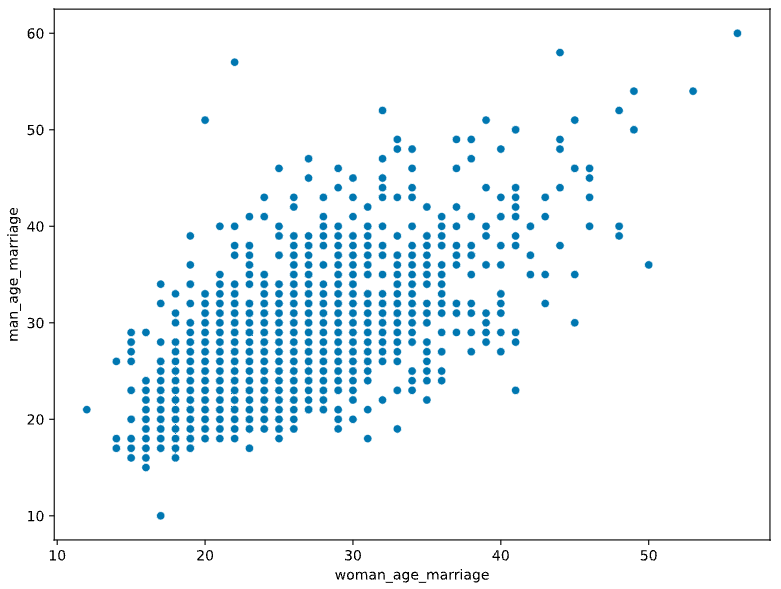
Gráfico de dispersão com variáveis categóricas