Pruebas de proporciones de una muestra
Pruebas de hipótesis en Python

James Chapman
Curriculum Manager, DataCamp
Cálculo del p-valor
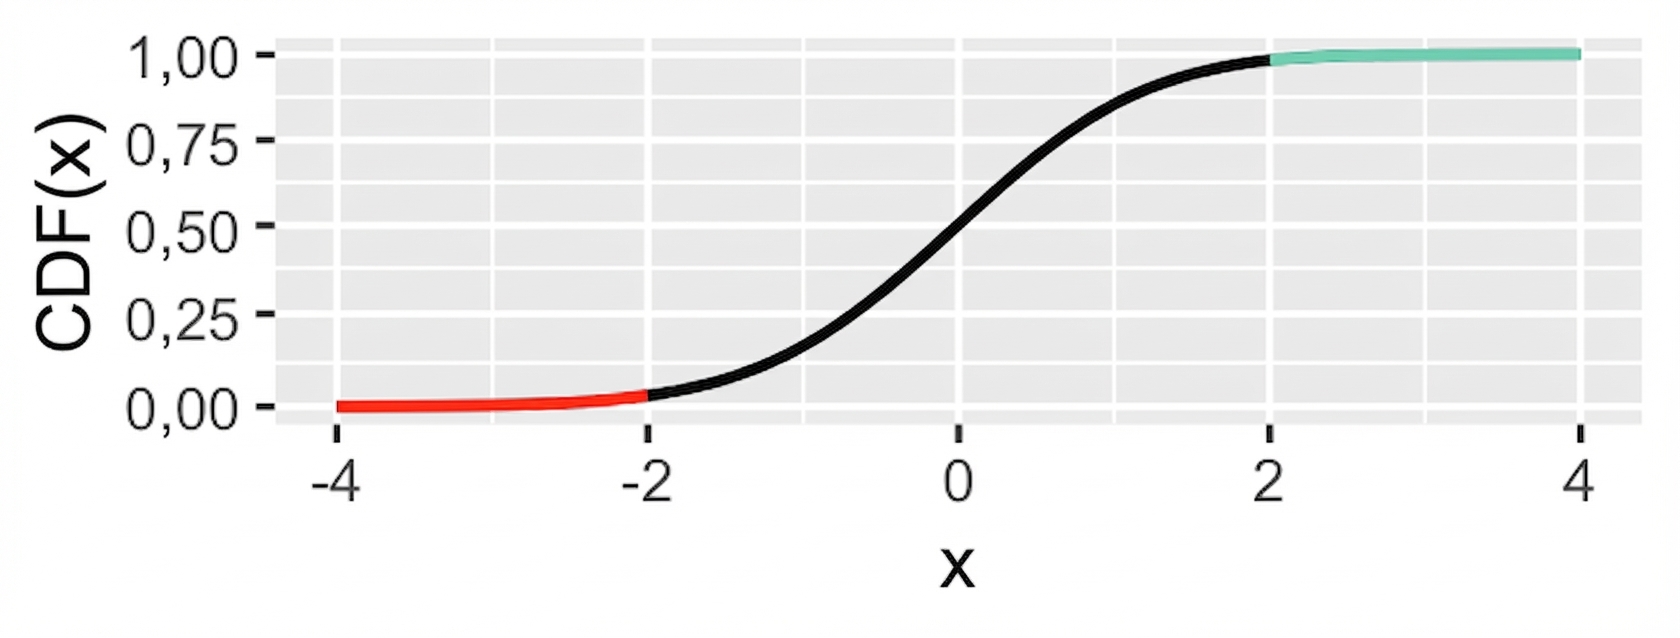 Cola izquierda ("menor que"):
from scipy.stats import norm
p_value = norm.cdf(z_score)
Cola derecha ("mayor que"):
p_value = 1 - norm.cdf(z_score)

