t de Student pareadas
Pruebas de hipótesis en Python

James Chapman
Curriculum Manager, DataCamp
Conjunto de datos de presidentes republicanos de EE. UU.
         state       county  repub_percent_08  repub_percent_12
0      Alabama         Hale         38.957877         37.139882
1     Arkansas       Nevada         56.726272         58.983452
2   California         Lake         38.896719         39.331367
3   California      Ventura         42.923190         45.250693
..         ...          ...               ...               ...
96   Wisconsin    La Crosse         37.490904         40.577038
97   Wisconsin    Lafayette         38.104967         41.675050
98     Wyoming       Weston         76.684241         83.983328
99      Alaska  District 34         77.063259         40.789626

[100 rows x 4 columns]
100 filas; cada fila representa votos a nivel de condado en una elección presidencial.
Hipótesis
Pregunta: ¿El porcentaje de votos al candidato republicano fue menor en 2008 que en 2012?
$H_{0}$: $\mu_{2008} - \mu_{2012} = 0$
$H_{A}$: $\mu_{2008} - \mu_{2012} < 0$
Fija el nivel de significancia $\alpha = 0.05$.
- Datos pareados → cada porcentaje corresponde al mismo condado
- Queremos capturar patrones de voto en el modelo
De dos muestras a una
sample_data = repub_votes_potus_08_12
sample_data['diff'] = sample_data['repub_percent_08'] - sample_data['repub_percent_12']
import matplotlib.pyplot as plt
sample_data['diff'].hist(bins=20)
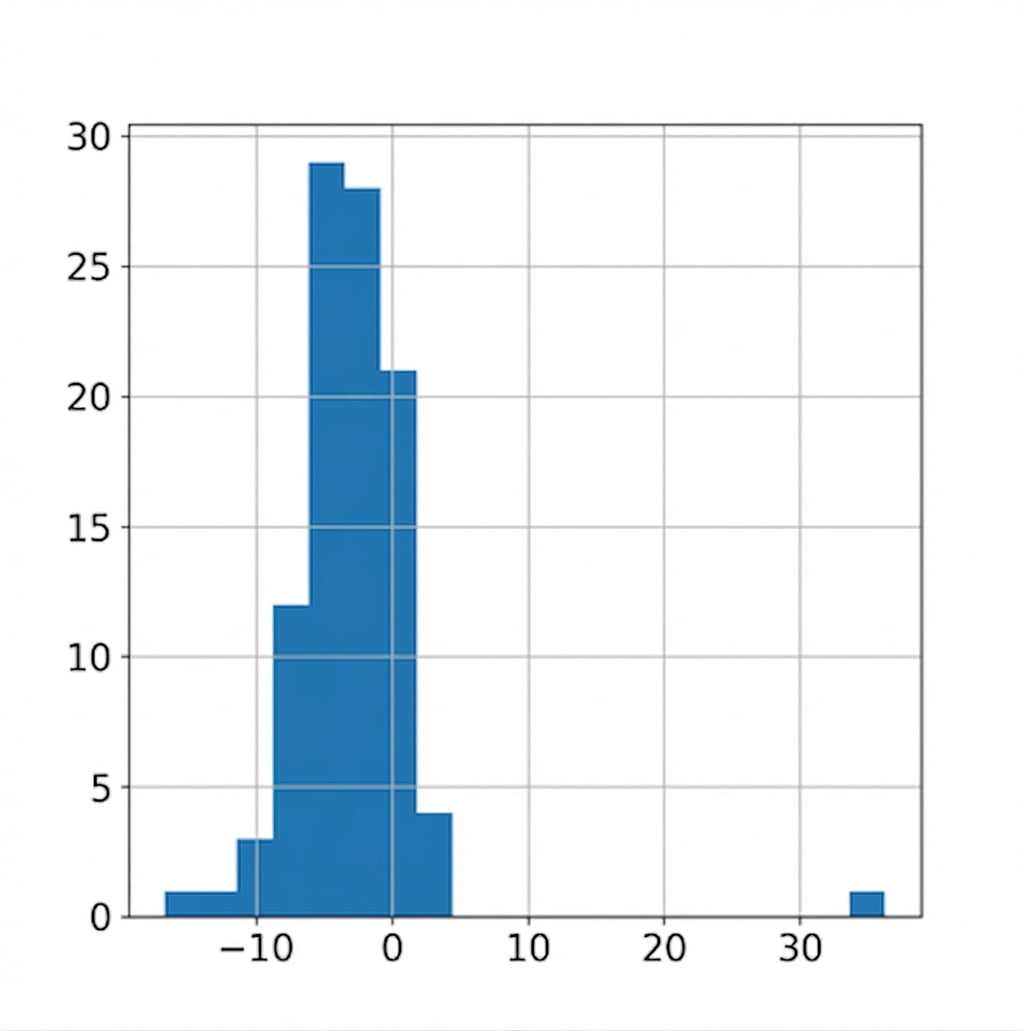
Calcular estadísticas muestrales de la diferencia
xbar_diff = sample_data['diff'].mean()
-2.877109041242944
Revisión de hipótesis
Hipótesis antiguas:
$H_{0}$: $\mu_{2008} - \mu_{2012} = 0$
$H_{A}$: $\mu_{2008} - \mu_{2012} < 0$
Hipótesis nuevas:
$H_{0}$: $\mu_{\text{diff}} = 0$
$H_{A}$: $ \mu_{\text{diff}} < 0$
$t = \dfrac{\bar{x}_{\text{diff}} - \mu_{\text{diff}}}{\sqrt{\dfrac{s_{diff}^2}{n_{\text{diff}}}}}$
$df = n_{diff} - 1$
Cálculo del valor p
n_diff = len(sample_data)
100
s_diff = sample_data['diff'].std()
t_stat = (xbar_diff-0) / np.sqrt(s_diff**2/n_diff)
-5.601043121928489
degrees_of_freedom = n_diff - 1
99
$t = \dfrac{\bar{x}_{\text{diff}} - \mu_{\text{diff}}}{\sqrt{\dfrac{s_{\text{diff}}^2}{n_{\text{diff}}}}}$
$df = n_{\text{diff}} - 1$
from scipy.stats import t
p_value = t.cdf(t_stat, df=n_diff-1)
9.572537285272411e-08
Probar diferencias entre dos medias con ttest()
import pingouinpingouin.ttest(x=sample_data['diff'],y=0,alternative="less")
               T  dof alternative         p-val          CI95%   cohen-d  \
T-test -5.601043   99        less  9.572537e-08  [-inf, -2.02]  0.560104

             BF10  power
T-test  1.323e+05    1.0
ttest() con paired=True
pingouin.ttest(x=sample_data['repub_percent_08'],
               y=sample_data['repub_percent_12'],
               paired=True,
               alternative="less")
               T  dof alternative         p-val          CI95%   cohen-d  \
T-test -5.601043   99        less  9.572537e-08  [-inf, -2.02]  0.217364

             BF10     power
T-test  1.323e+05  0.696338
ttest() no pareado
pingouin.ttest(x=sample_data['repub_percent_08'],
               y=sample_data['repub_percent_12'],
               paired=False, # The default
               alternative="less")
               T  dof alternative     p-val         CI95%   cohen-d   BF10  \
T-test -1.536997  198        less  0.062945  [-inf, 0.22]  0.217364  0.927

           power
T-test  0.454972
- Usar t-test no pareado con datos pareados aumenta el riesgo de falsos negativos
¡Vamos a practicar!
Pruebas de hipótesis en Python

