DAX para crear tablas y columnas
Funciones DAX en Power BI

Carl Rosseel
Curriculum Manager at DataCamp
DAX significa data analysis expressions
- DAX es un lenguaje de expresiones de fórmulas usado en varias herramientas de análisis de Microsoft
- Las fórmulas DAX incluyen funciones, operadores y valores para cálculos avanzados
- Las fórmulas DAX se usan en:
- Medidas
- Columnas calculadas
- Tablas calculadas
- Seguridad a nivel de fila
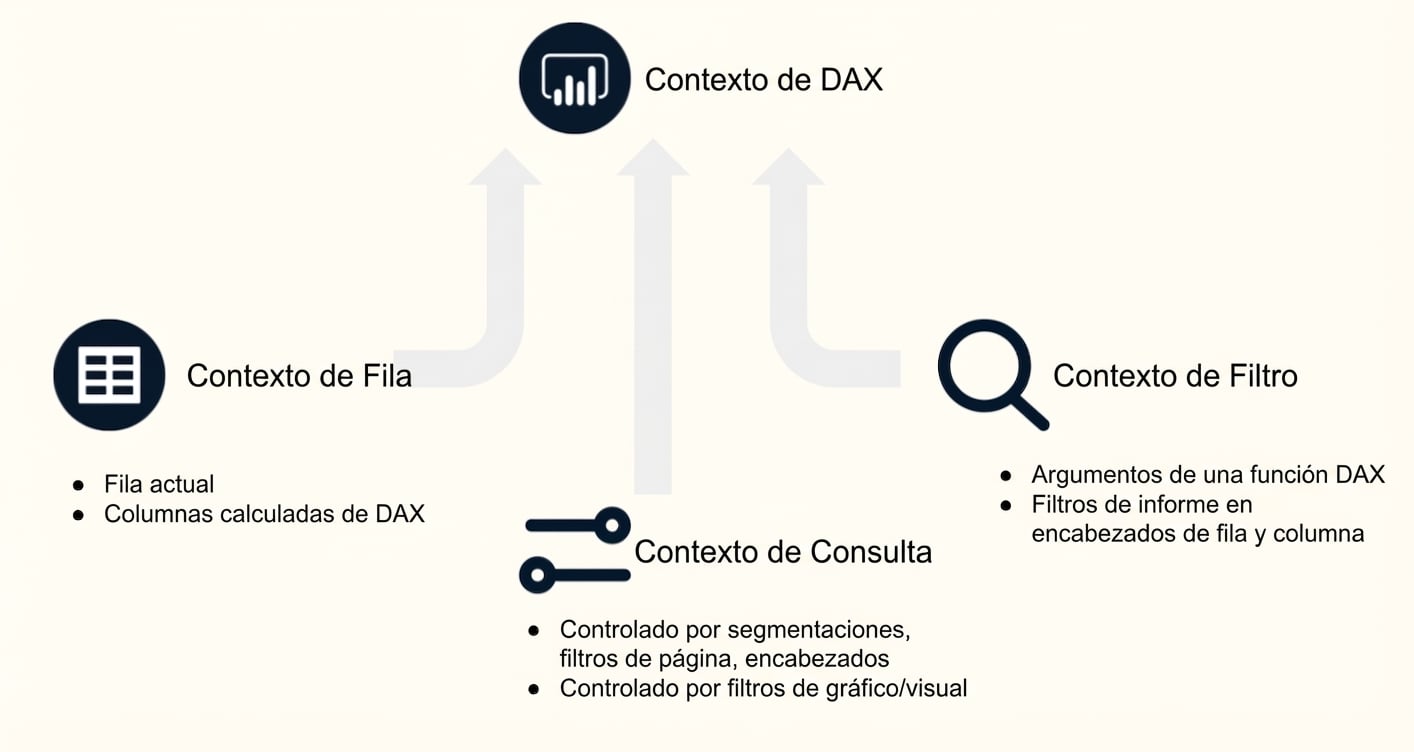
El contexto en pocas palabras
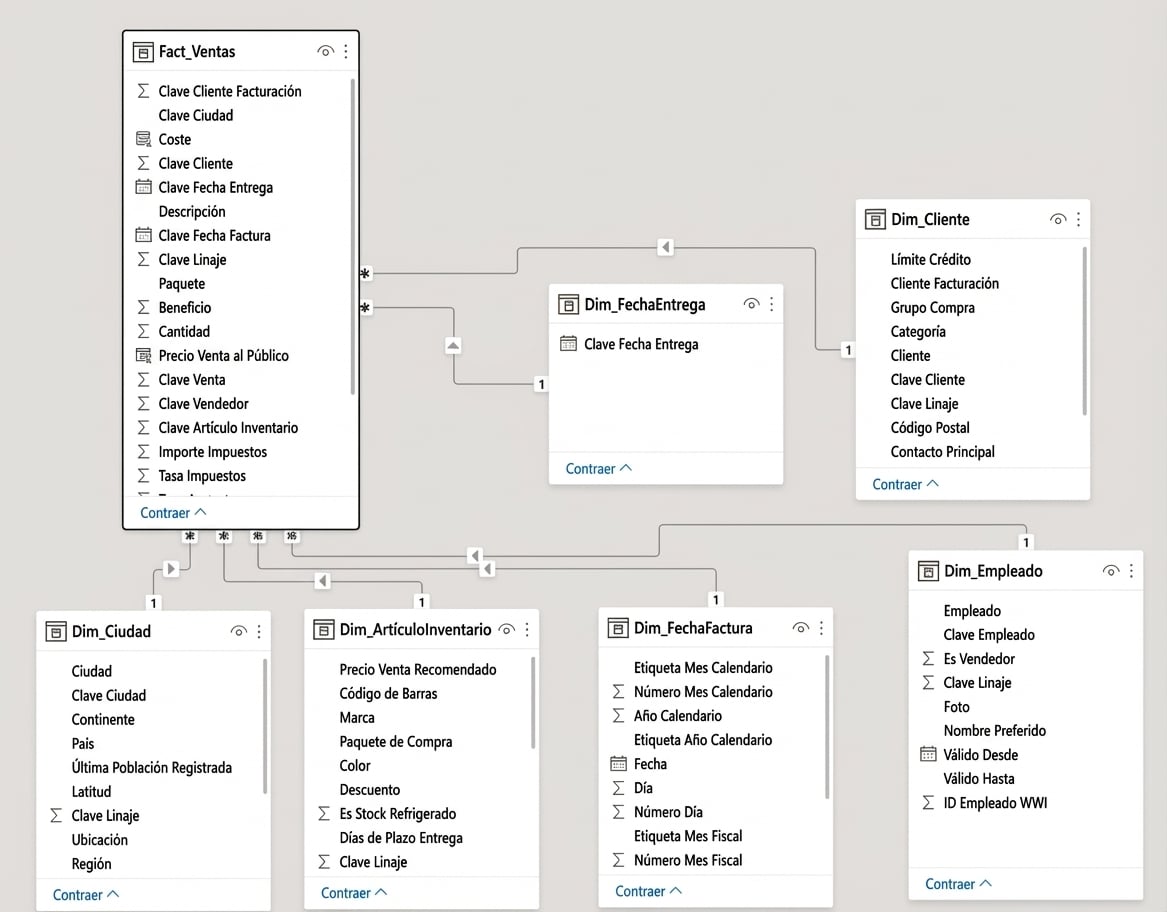
Conjunto de datos de World Wide Importers