Filtering and counting with DAX

DAX Functions in Power BI

Maarten Van den Broeck

Content Developer at DataCamp

Filter functions

  • Filters are applied on the filter context
  • Filters take precedence over any visual
Total Sales = SUM(Orders[Sales])

DAX Functions in Power BI

Filter functions

  • Filters are applied on the filter context
  • Filters take precedence over any visual
Total Sales = SUM(Orders[Sales])
CALCULATE(<expression>, 
            <filter1> , [<filter2> [, ...]])
  • Used with intermediate functions
Total Sales ALL = CALCULATE(
                    [Total Sales],
                    ALL(Orders))

$$ $$ $$

Region Total Sales
Central $501,239.89
East $678,781.24
South $391,721.91
West $725,457.82
TOTAL $2,297,200.86
DAX Functions in Power BI

Filter functions

  • Filters are applied on the filter context
  • Filters take precedence over any visual
Total Sales = SUM(Orders[Sales])
CALCULATE(<expression>, 
            <filter1> , [<filter2> [, ...]])
  • Used with intermediate functions
Total Sales ALL = CALCULATE(
                    [Total Sales],
                    ALL(Orders))

$$ $$ $$

Region Total Sales Total Sales ALL
Central $501,239.89 $2,297,200.86
East $678,781.24 $2,297,200.86
South $391,721.91 $2,297,200.86
West $725,457.82 $2,297,200.86
TOTAL $2,297,200.86 $2,297,200.86
DAX Functions in Power BI

More filter options

  • FILTER(<table>, <filter>)
    • Returns a filtered table
Total Sales Chuck = 
CALCULATE(
    [Total Sales],
    FILTER(Fact_Orders,
        RELATED(Dim_Sales[Salesperson]) = "Chuck"))
DAX Functions in Power BI

More filter options

  • FILTER(<table>, <filter>)
    • Returns a filtered table
Total Sales Chuck = 
CALCULATE(
    [Total Sales],
    FILTER(Fact_Orders,
        RELATED(Dim_Sales[Salesperson]) = "Chuck"))
Total Sales Total Sales Chuck
$2,297,200.86 $235,856.05

$$

  • RELATED() is used to return values from another table
DAX Functions in Power BI

More filter options

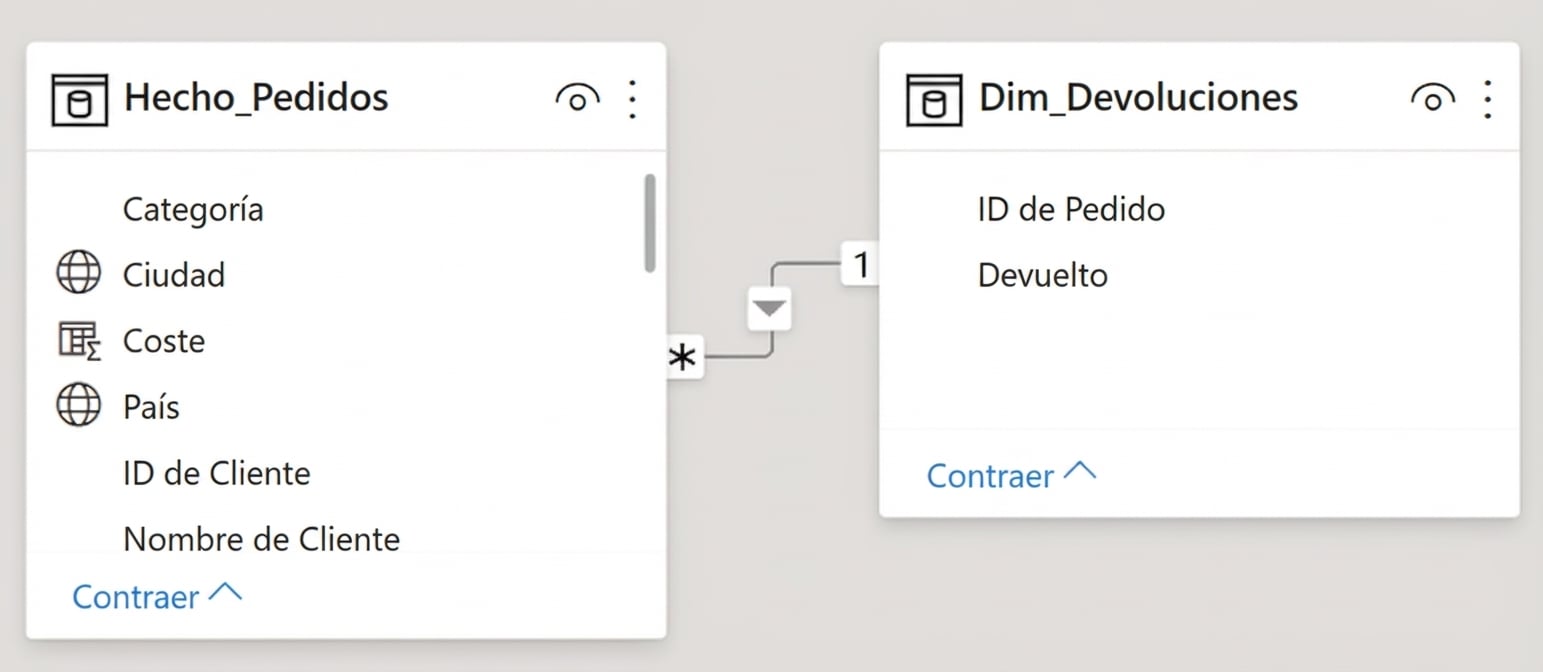
  • CROSSFILTER(<col1>, <col2>, <direction>)
    • Specifies the cross-filtering direction between two columns

Single direction relationship between two tables, Fact_Orders and Dim_Returns

CROSSFILTER(Dim_Returns[Order ID], 
            Fact_Orders[Order ID],
            Both)
  • Overrides relationship direction of data model
DAX Functions in Power BI

The benefits of filtering in DAX

  • Improves performance
    • Filter out unnecessary data
    • Define specific relationships between tables
  • Reusability
    • Refer to other calculated measures
  • More complex computations
    • Concise syntax
DAX Functions in Power BI

Counting

  • COUNT(<column>)
    • Returns the amount of rows with numbers, dates, or strings in a column
  • COUNTA(<column>)
    • Returns the amount of rows with numbers, dates, strings, or booleans in a column
  • COUNTBLANKS(<column>)
    • Returns the amount of blank rows
  • DISTINCTCOUNT(<column>)
    • Returns the amount of distinct values in a column
  • COUNTROWS(<table>)
    • Returns the amount of rows with numbers, dates, and strings in a table
DAX Functions in Power BI

Let's practice!

DAX Functions in Power BI

Preparing Video For Download...