Personalizar gráficos de dispersión
Introducción a la visualización de datos con Seaborn

Content Team
DataCamp
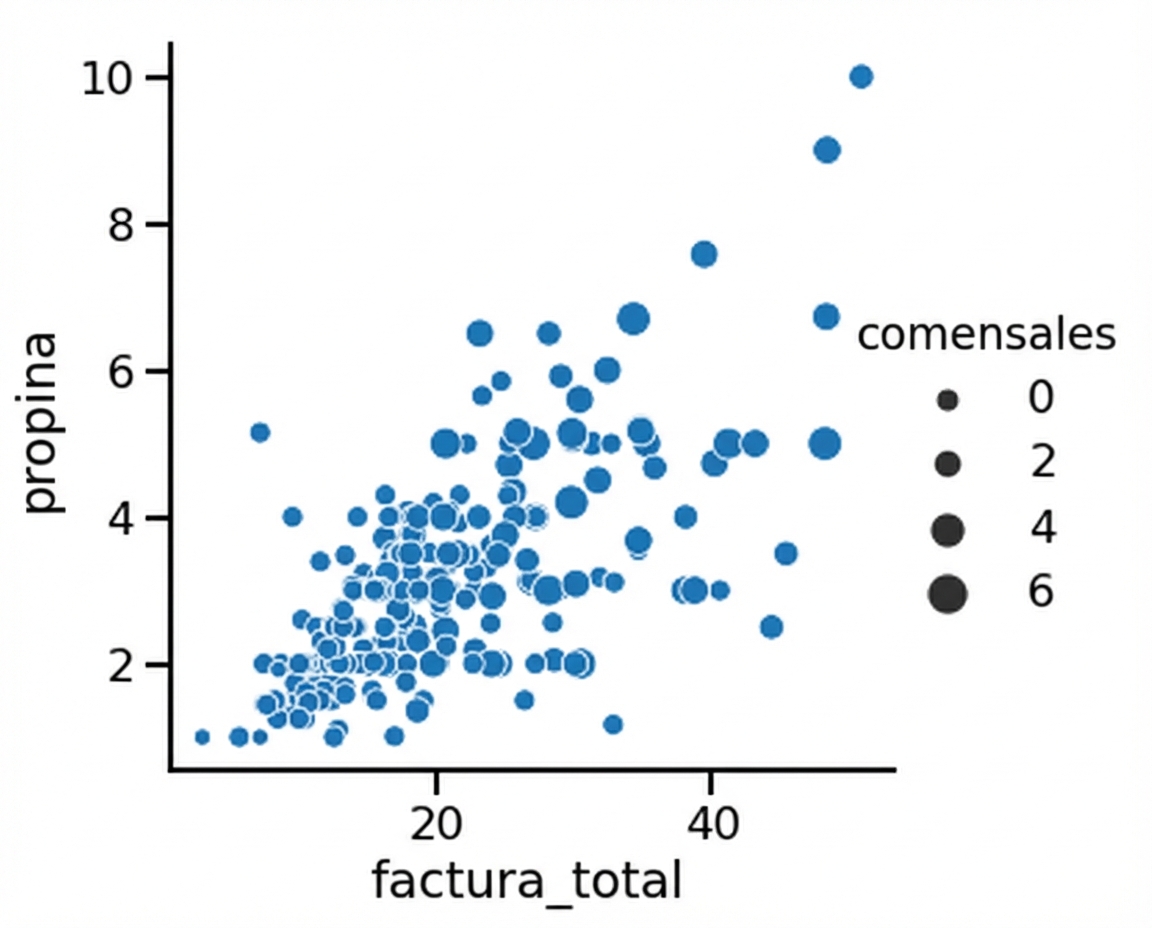
Subgrupos con tamaño de punto
1 Waskom, M. L. (2021). seaborn: statistical data visualization. https://seaborn.pydata.org/
Tamaño del punto y tono

1 Waskom, M. L. (2021). seaborn: statistical data visualization. https://seaborn.pydata.org/
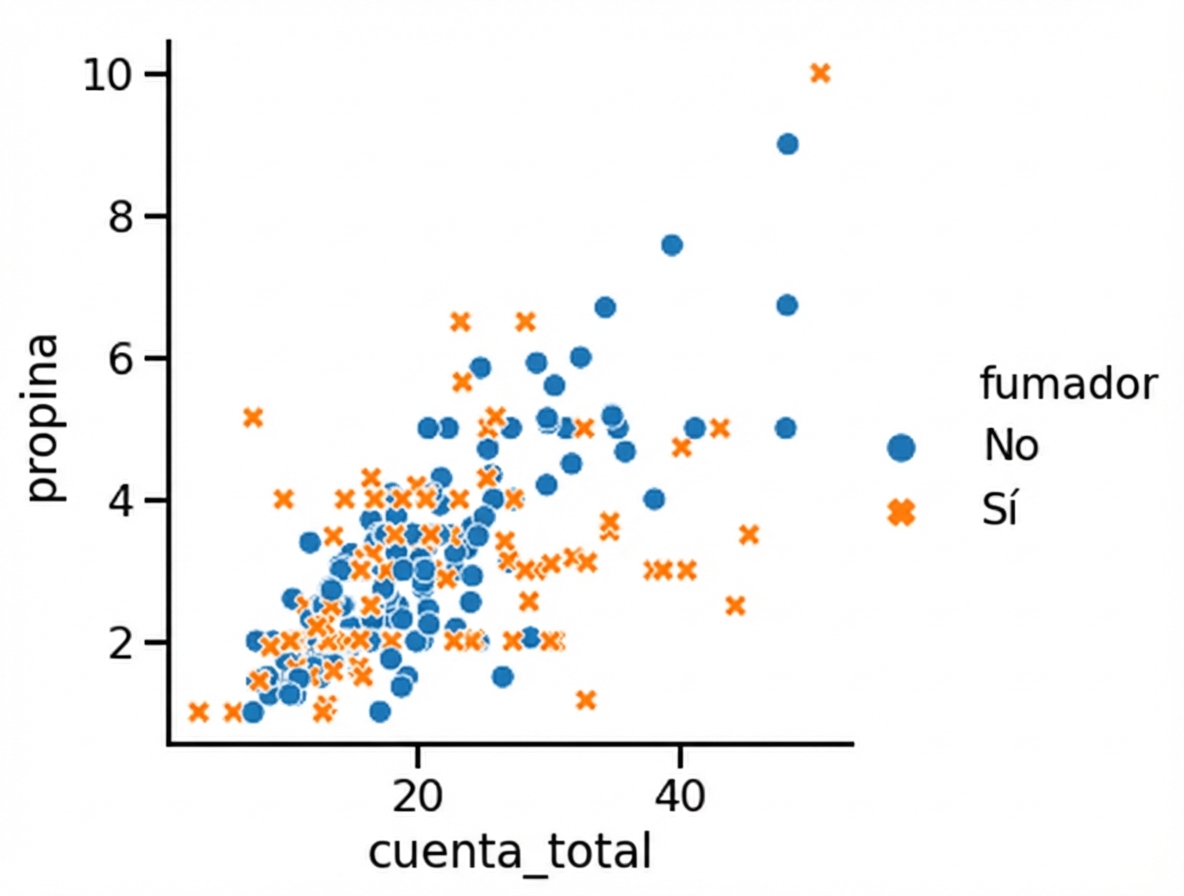
Subgrupos con estilo de puntos
1 Waskom, M. L. (2021). seaborn: statistical data visualization. https://seaborn.pydata.org/
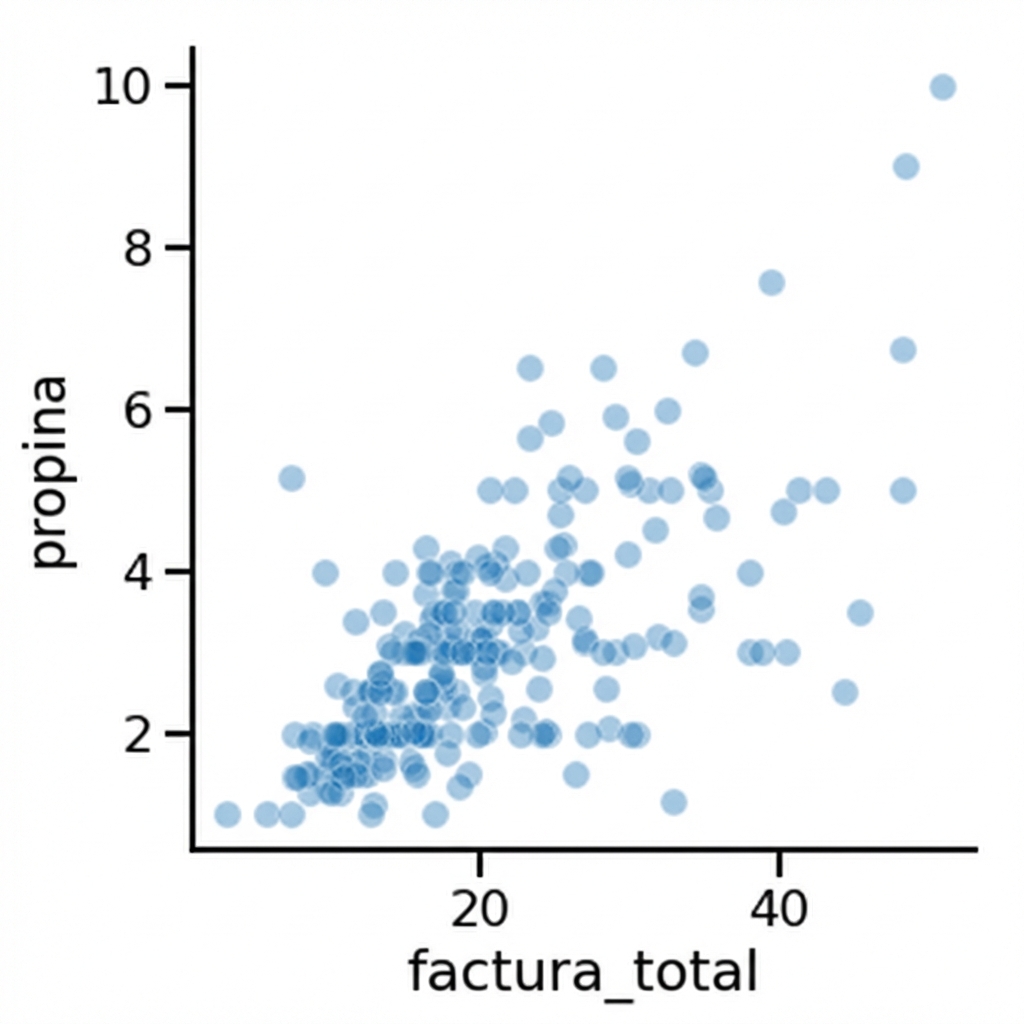
Cambiar la transparencia de los puntos
1 Waskom, M. L. (2021). seaborn: statistical data visualization. https://seaborn.pydata.org/

