Crear un diagrama de cajas
Introducción a la visualización de datos con Seaborn

Content Team
DataCamp
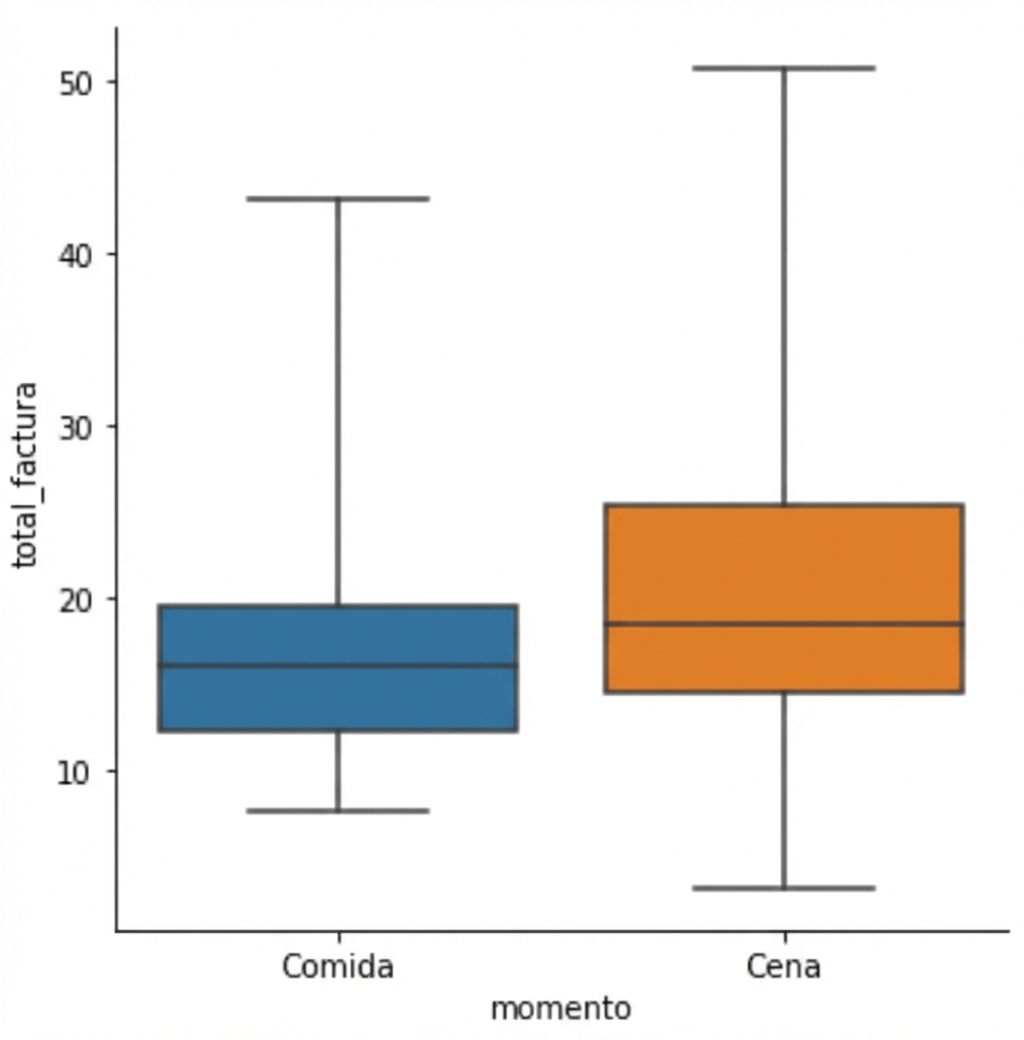
¿Qué es un gráfico de caja?
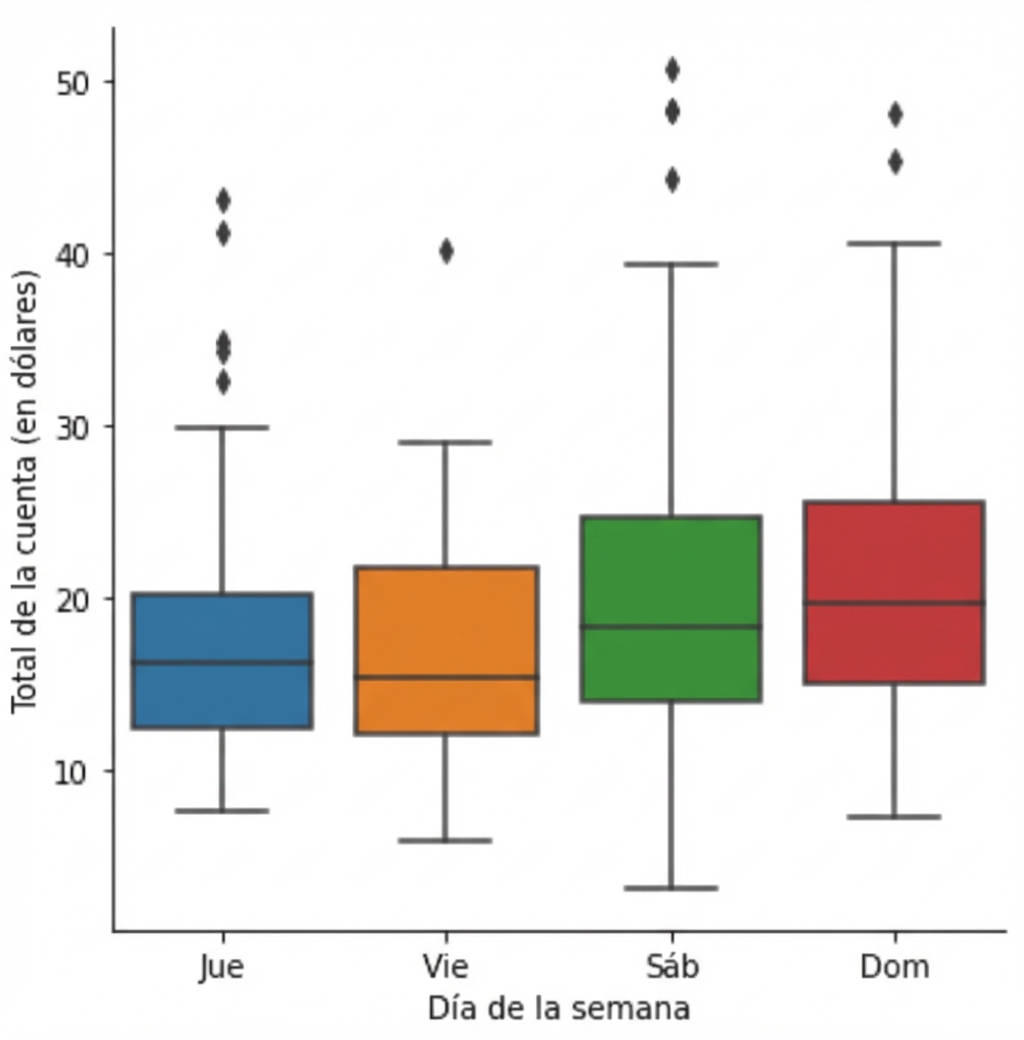
1 Waskom, M. L. (2021). seaborn: statistical data visualization. https://seaborn.pydata.org/
Cómo crear un gráfico de caja
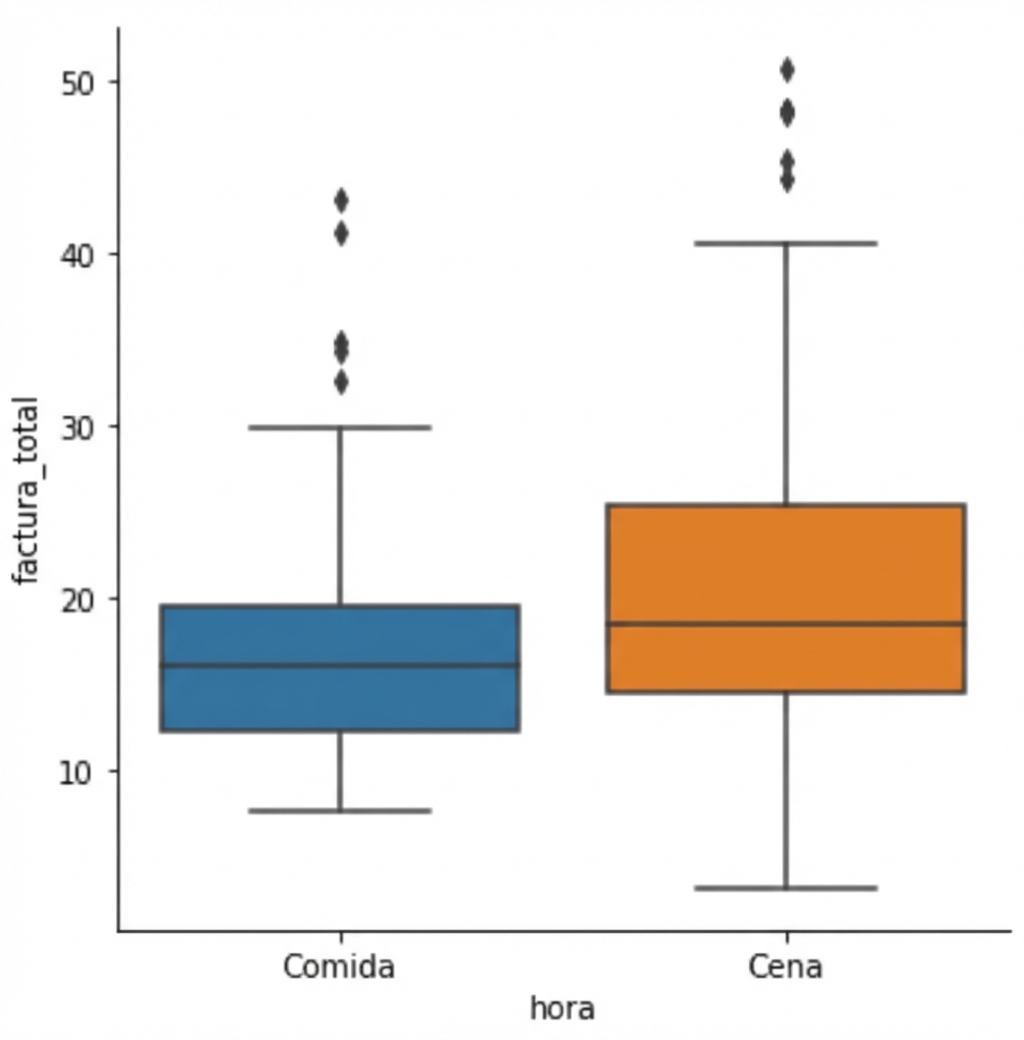
1 Waskom, M. L. (2021). seaborn: statistical data visualization. https://seaborn.pydata.org/
Cambiar el orden de las categorías
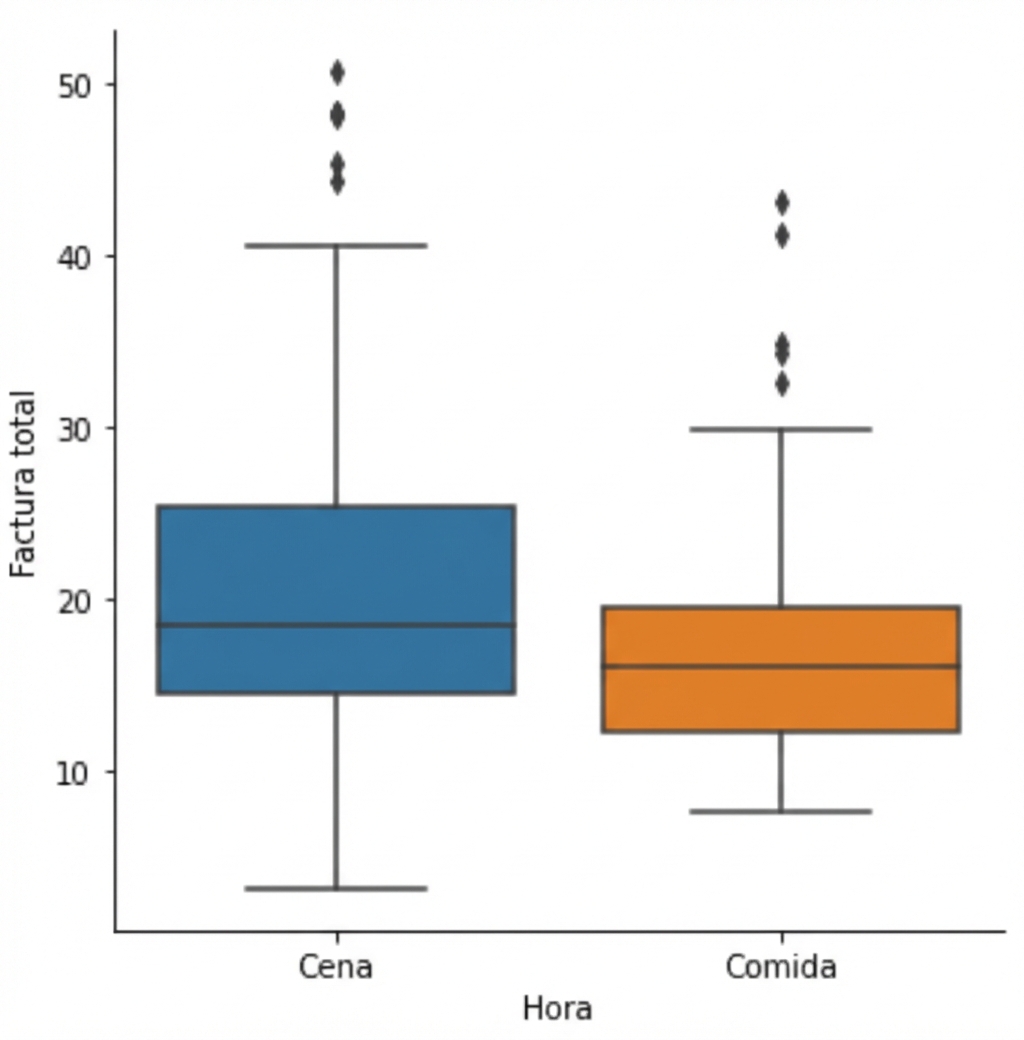
1 Waskom, M. L. (2021). seaborn: statistical data visualization. https://seaborn.pydata.org/
Omitiendo los valores atípicos
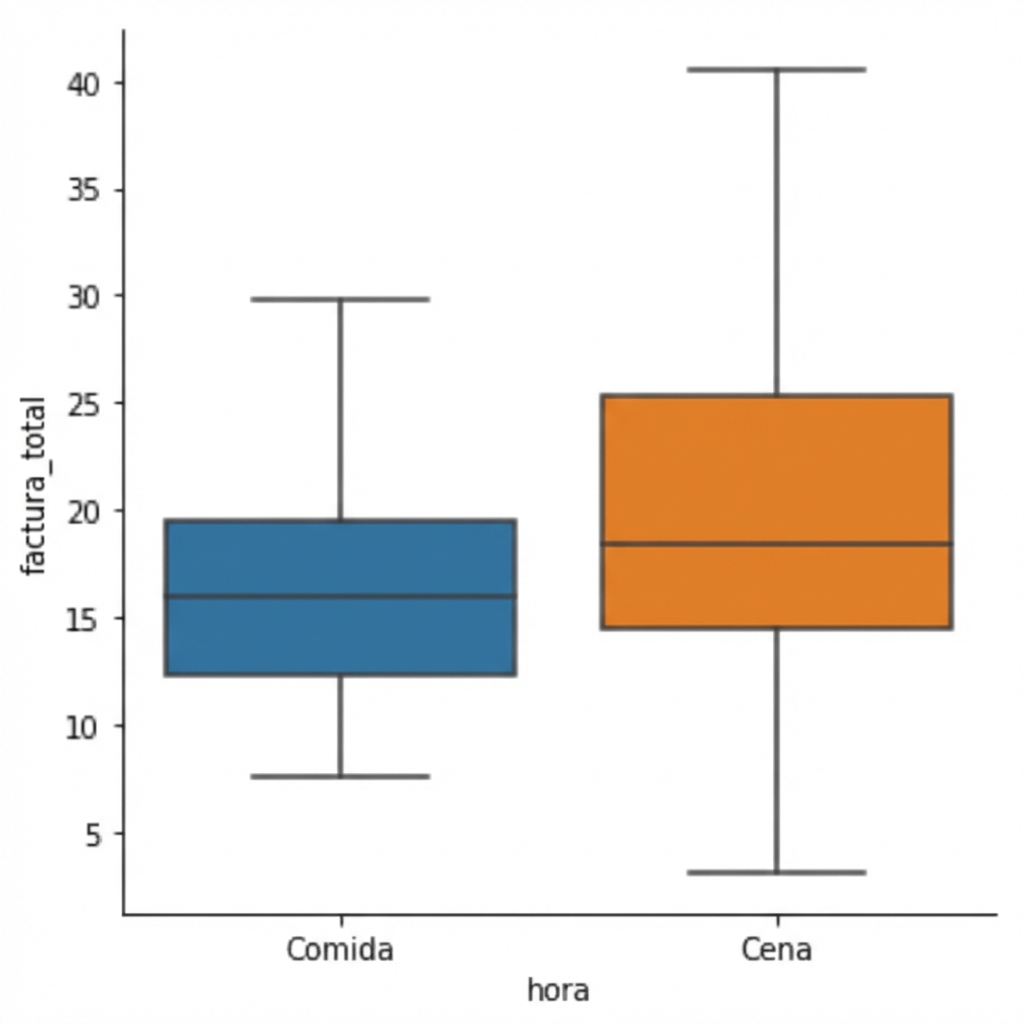
1 Waskom, M. L. (2021). seaborn: statistical data visualization. https://seaborn.pydata.org/
Cambiar los bigotes con `whis`
1 Waskom, M. L. (2021). seaborn: statistical data visualization. https://seaborn.pydata.org/

