Introducción a los gráficos y subgráficos relacionales
Introducción a la visualización de datos con Seaborn

Content Team
DataCamp
Preguntas sobre variables cuantitativas
Gráficos relacionales
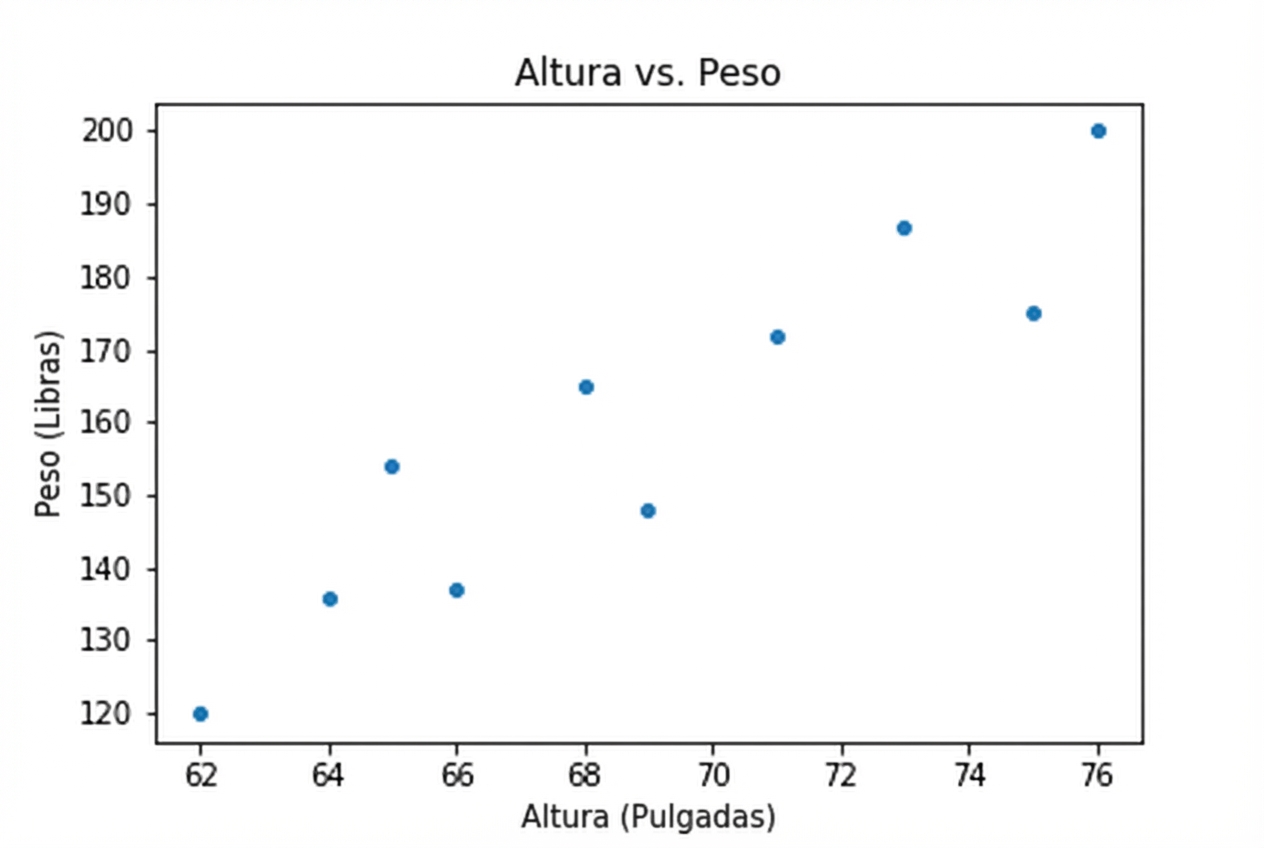
- Altura frente a peso
Preguntas sobre variables cuantitativas
Gráficos relacionales
- Altura frente a peso
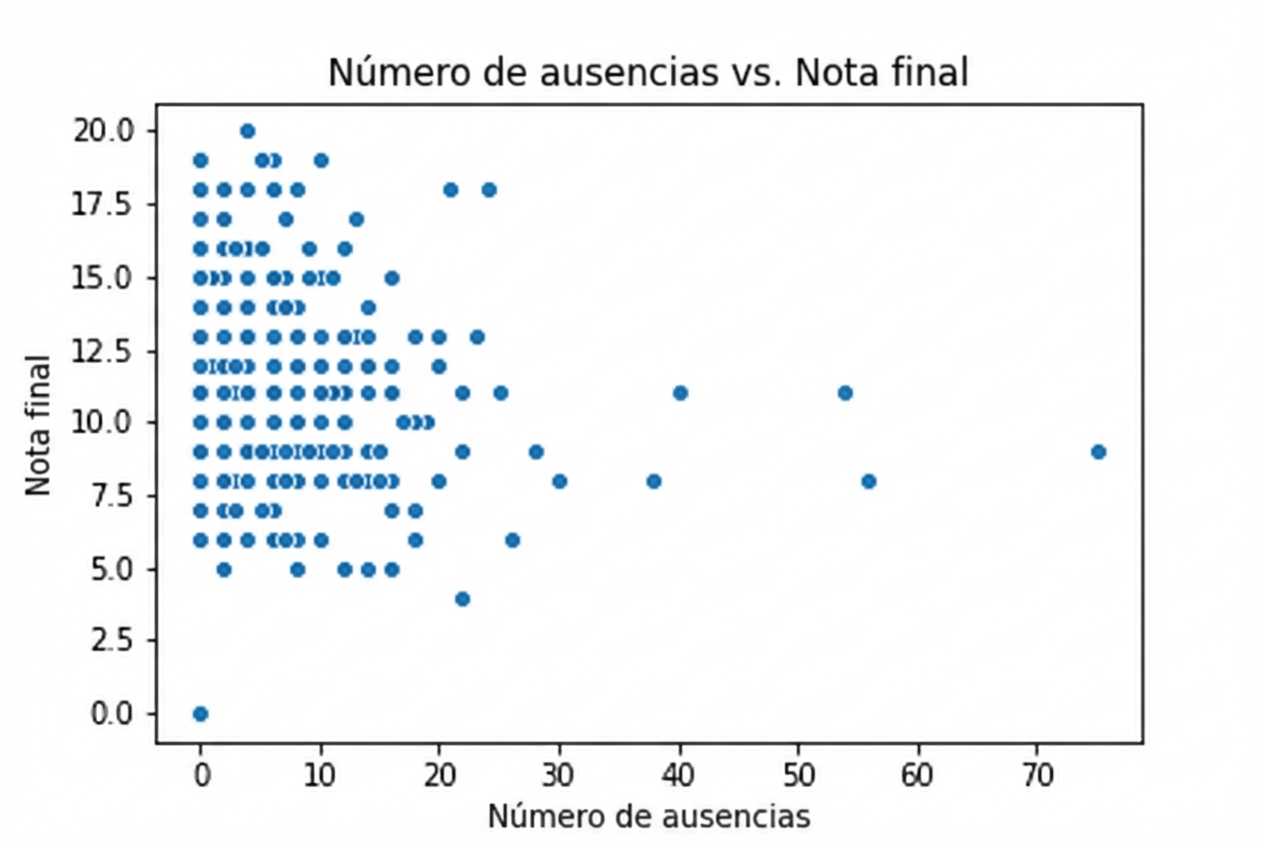
- Número de faltas escolares frente a la nota final
Preguntas sobre variables cuantitativas
Gráficos relacionales
- Altura frente a peso
- Número de faltas escolares frente a la nota final
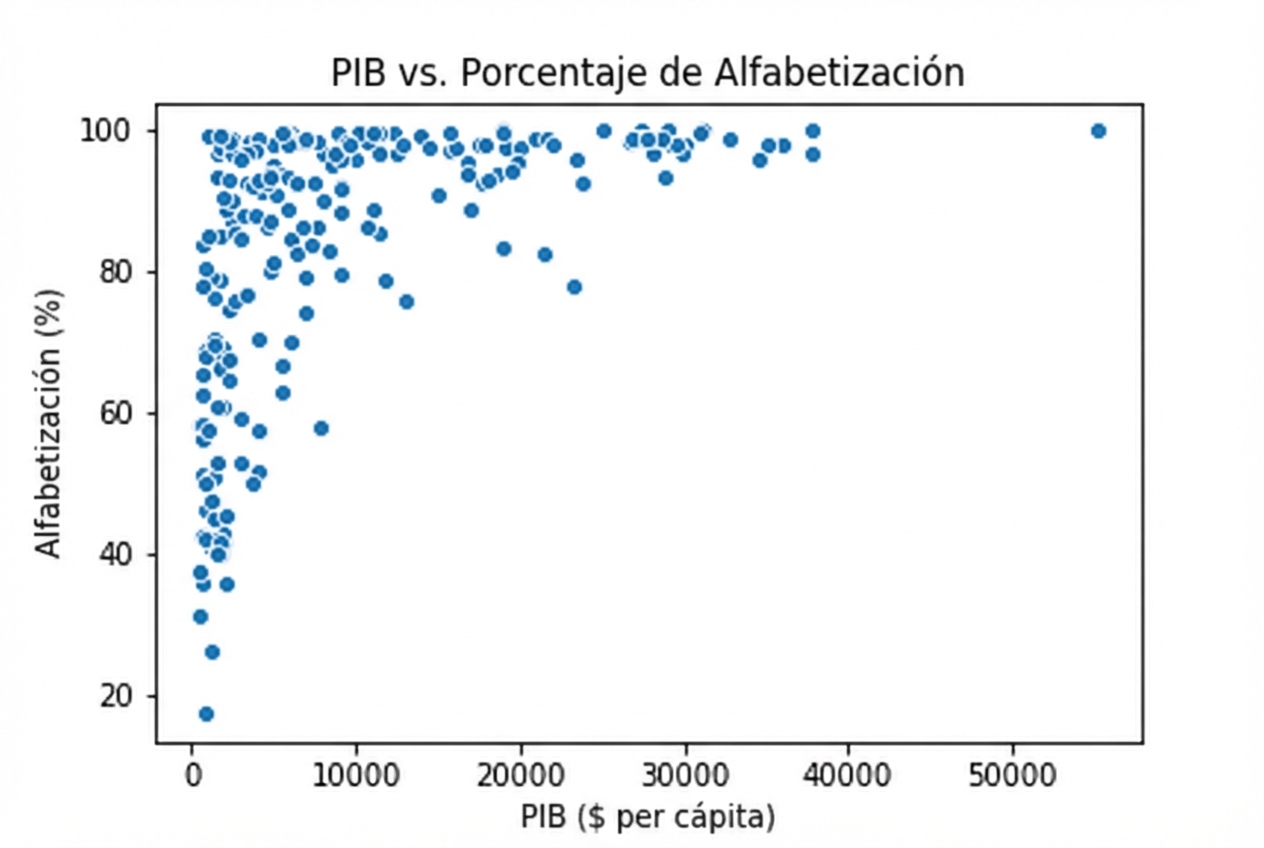
- PIB frente a porcentaje de alfabetizados
![Gráfico de dispersión con tono] (https://assets.datacamp.com/production/repositories/3996/datasets/6bbb4de40269753934111a6aa96bf367dd27e455/2.1_scatter_with_smoker_hue.png = 65)
Presentamos relplot()
- Crea «gráficos relacionales»: gráficos de dispersión o gráficos de líneas.
¿Por qué utilizar relplot() en lugar de scatterplot()?
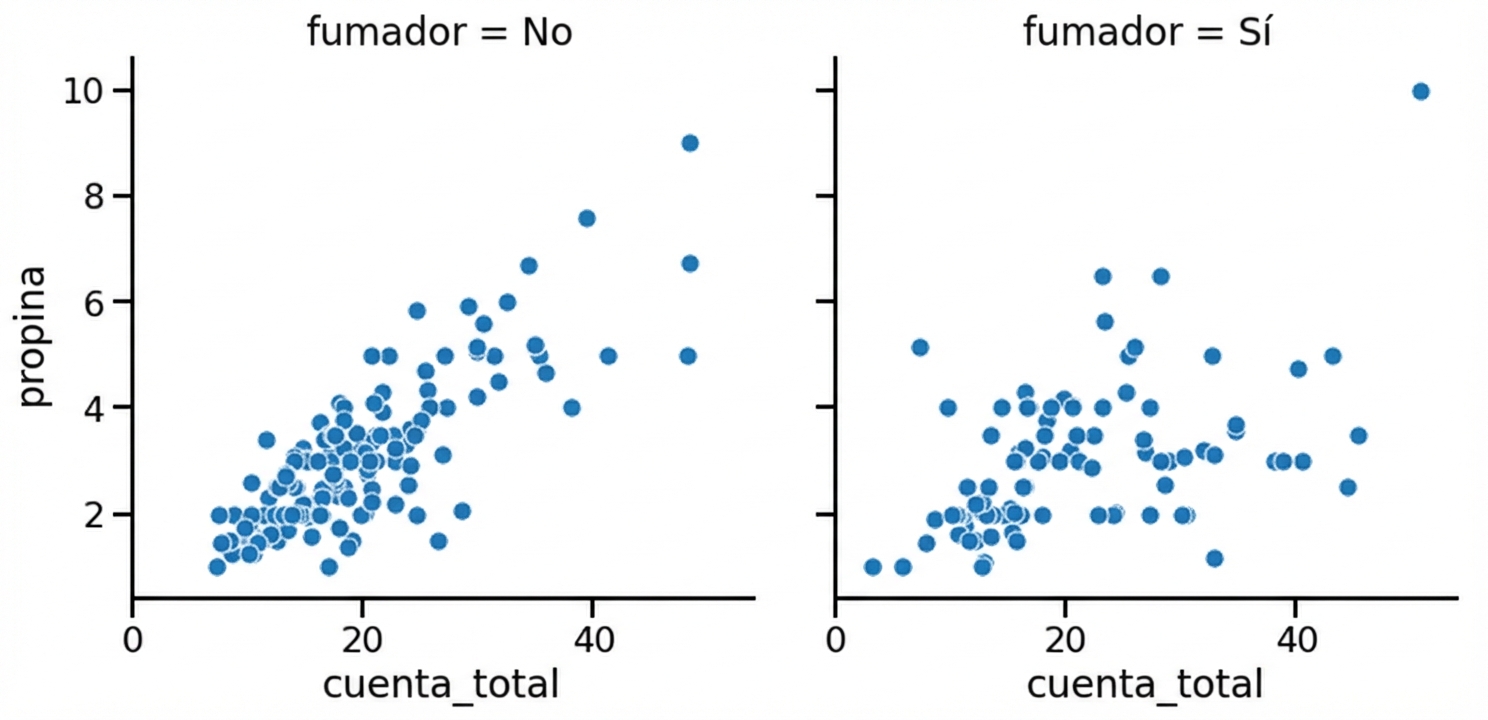
relplot()te permite crear subgráficos en una sola figura
scatterplot() frente a relplot()
Usar scatterplot()
import seaborn as sns
import matplotlib.pyplot as plt

sns.scatterplot(x="total_bill",
                y="tip",
                data=tips)

plt.show()
Usar relplot()
import seaborn as sns
import matplotlib.pyplot as plt

sns.relplot(x="total_bill",
            y="tip",
            data=tips,
            kind="scatter")

plt.show()
Subgráficos en columnas
import seaborn as sns import matplotlib.pyplot as plt sns.relplot(x="total_bill", y="tip", data=tips, kind="scatter", col="smoker")plt.show()

Subgráficos en filas
import seaborn as sns import matplotlib.pyplot as plt sns.relplot(x="total_bill", y="tip", data=tips, kind="scatter", row="smoker")plt.show()
![Gráfico de dispersión con subgráficos de fumadores en filas] (https://assets.datacamp.com/production/repositories/3996/datasets/ff5b9ffa57896bf891c928080d5f756f26cb021f/2.1_scatter_with_smoker_row.png = 40)
Subgráficos en filas y columnas
import seaborn as sns import matplotlib.pyplot as plt sns.relplot(x="total_bill", y="tip", data=tips, kind="scatter", col="smoker", row="time")plt.show()
![Gráfico de dispersión con subgráficos para fumadores y tiempo] (https://assets.datacamp.com/production/repositories/3996/datasets/54799eabb6badbbbeea39d9da9a817c390c18898/2.1_scatter_with_smoker_col_time_row.png = 85)
Subgrupos para los días de la semana
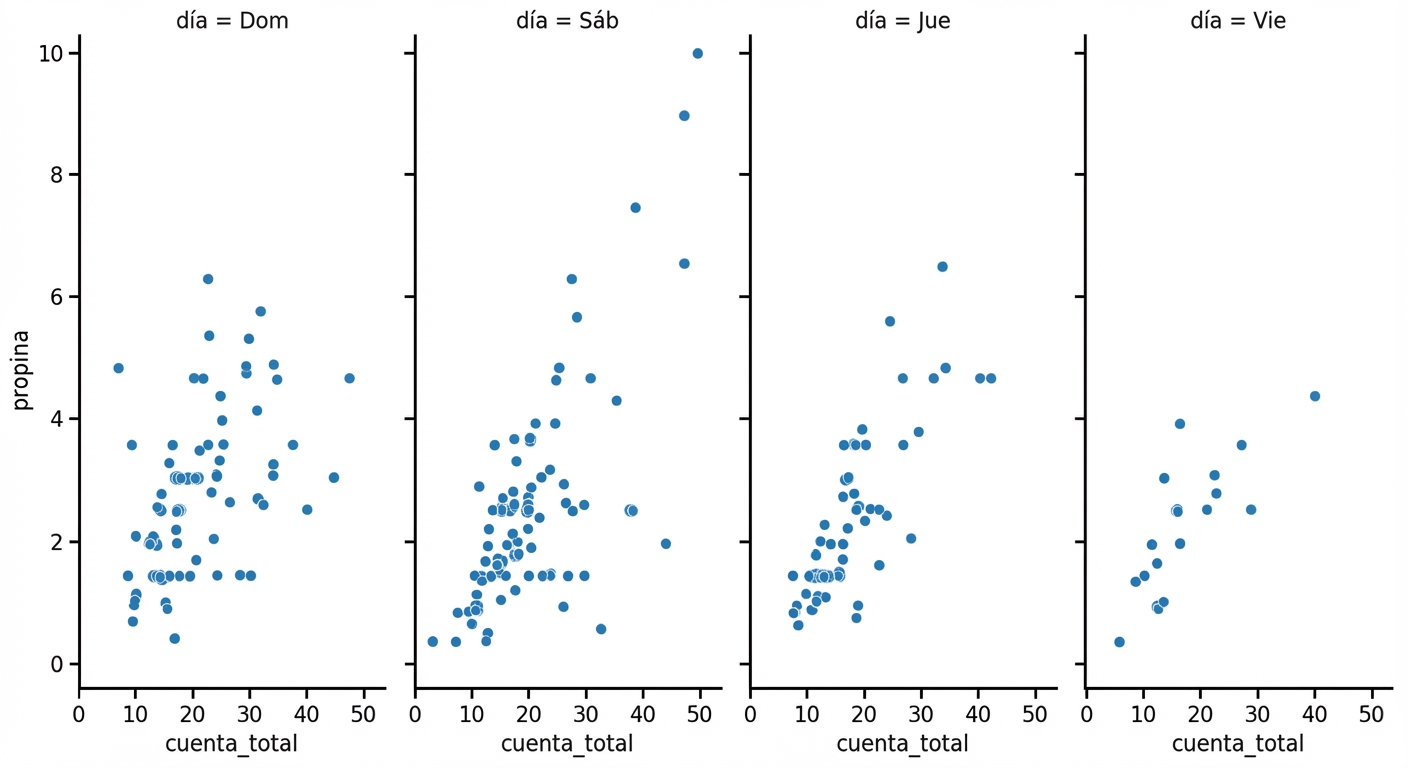
Envolver columnas
import seaborn as sns import matplotlib.pyplot as plt sns.relplot(x="total_bill", y="tip", data=tips, kind="scatter", col="day", col_wrap=2)plt.show()
![Gráfico de dispersión con subgráficos diarios en columnas en dos filas] (https://assets.datacamp.com/production/repositories/3996/datasets/dcff6ddde8c6088cb378c49a48ea54df3f258cac/2.1_scatter_with_day_colwrap.png = 85)
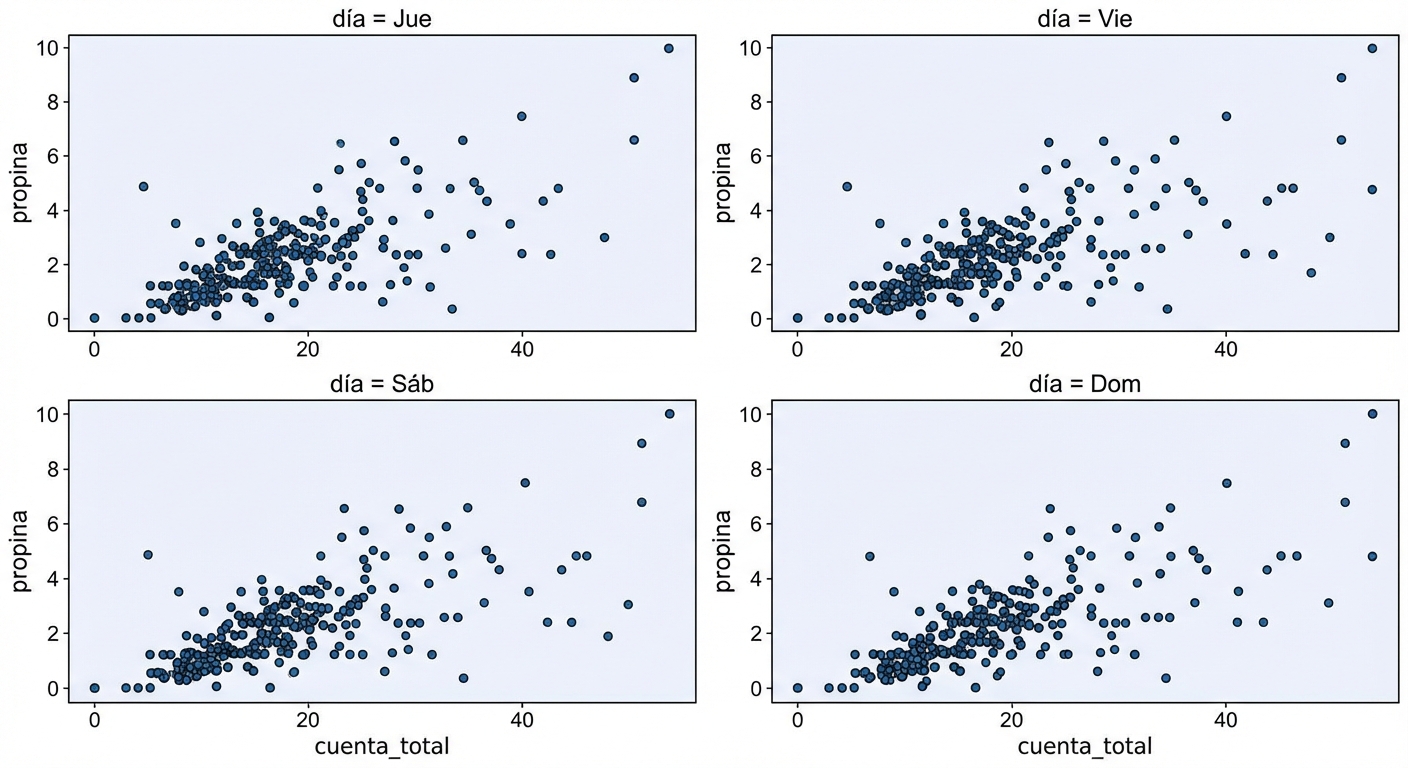
Ordenar columnas
import seaborn as sns import matplotlib.pyplot as plt sns.relplot(x="total_bill", y="tip", data=tips, kind="scatter", col="day", col_wrap=2, col_order=["Thur", "Fri", "Sat", "Sun"])plt.show()
¡Vamos a practicar!
Introducción a la visualización de datos con Seaborn

