Intervalos de confianza
Muestreo en Python

James Chapman
Curriculum Manager, DataCamp
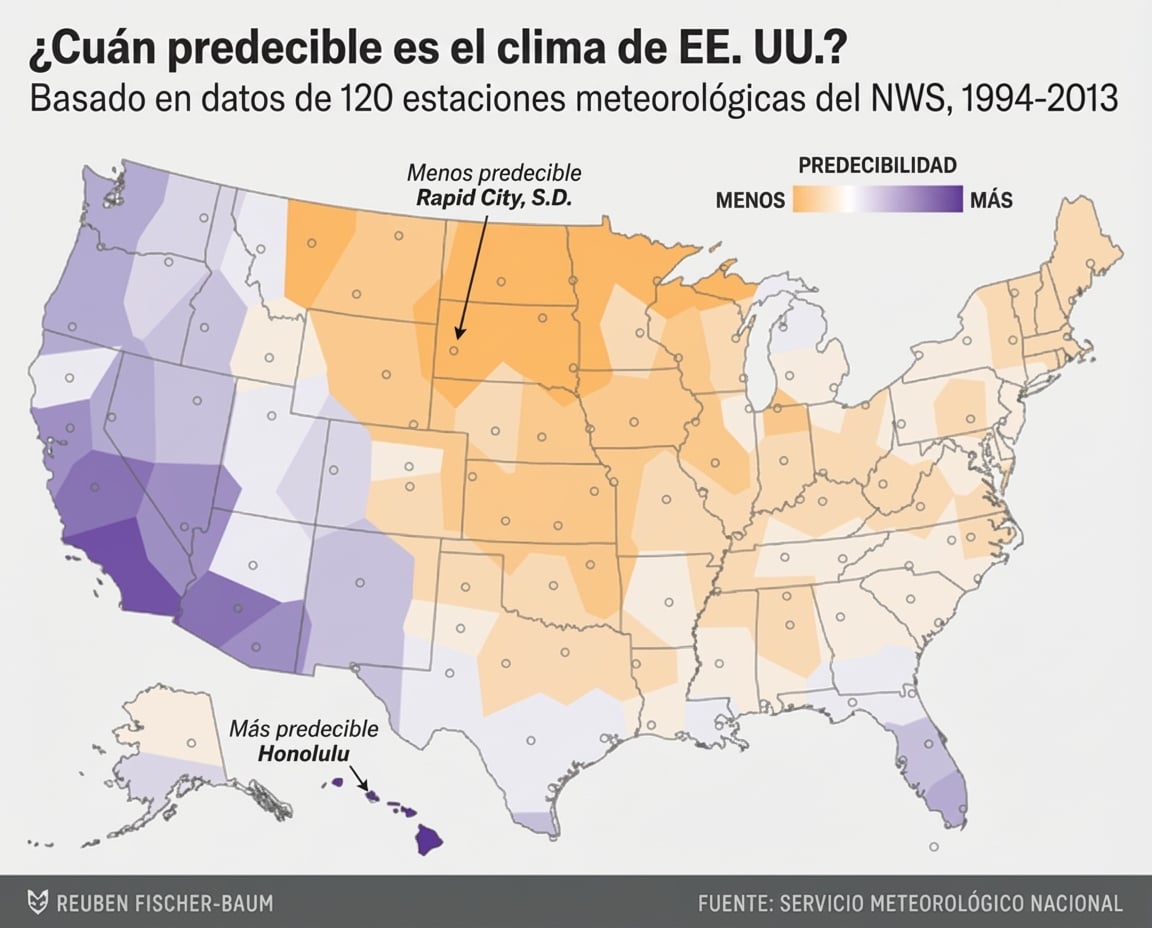
Predecir el tiempo
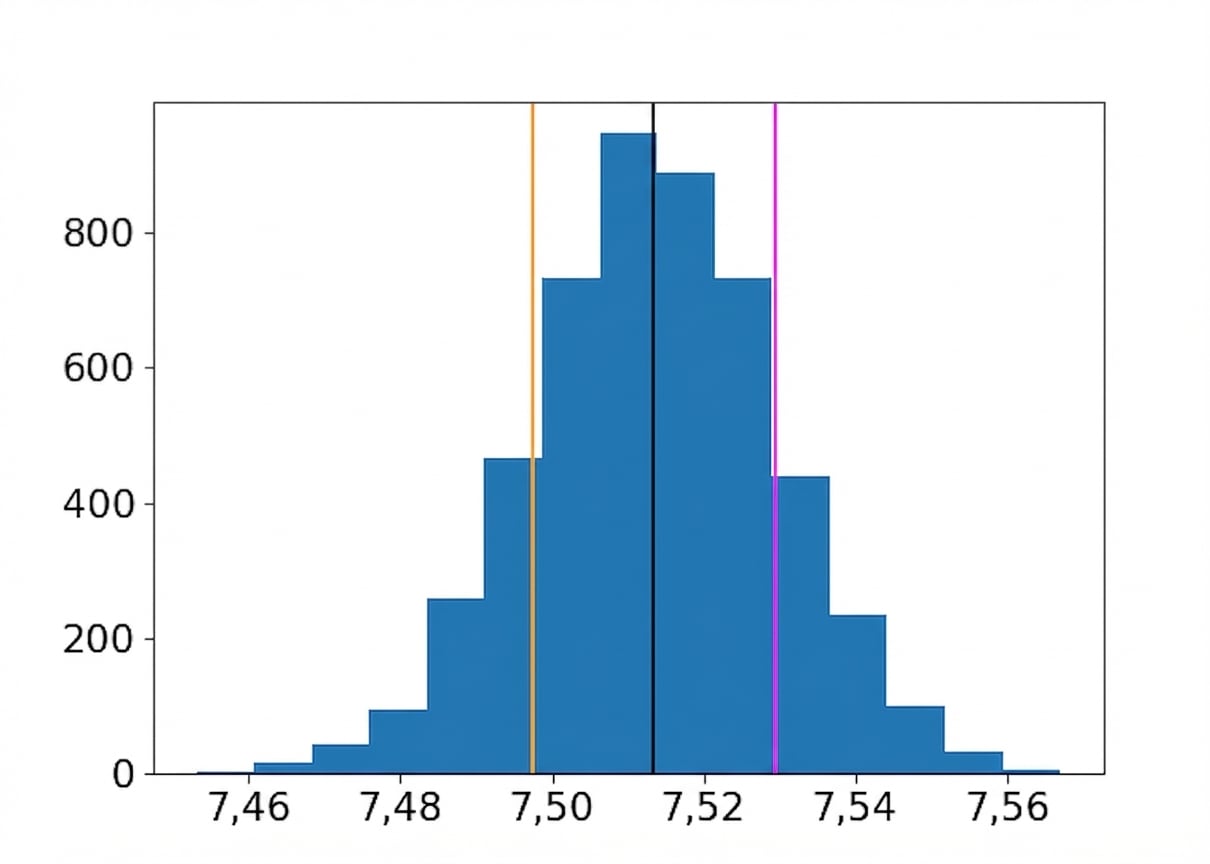
Distribución bootstrap del sabor medio
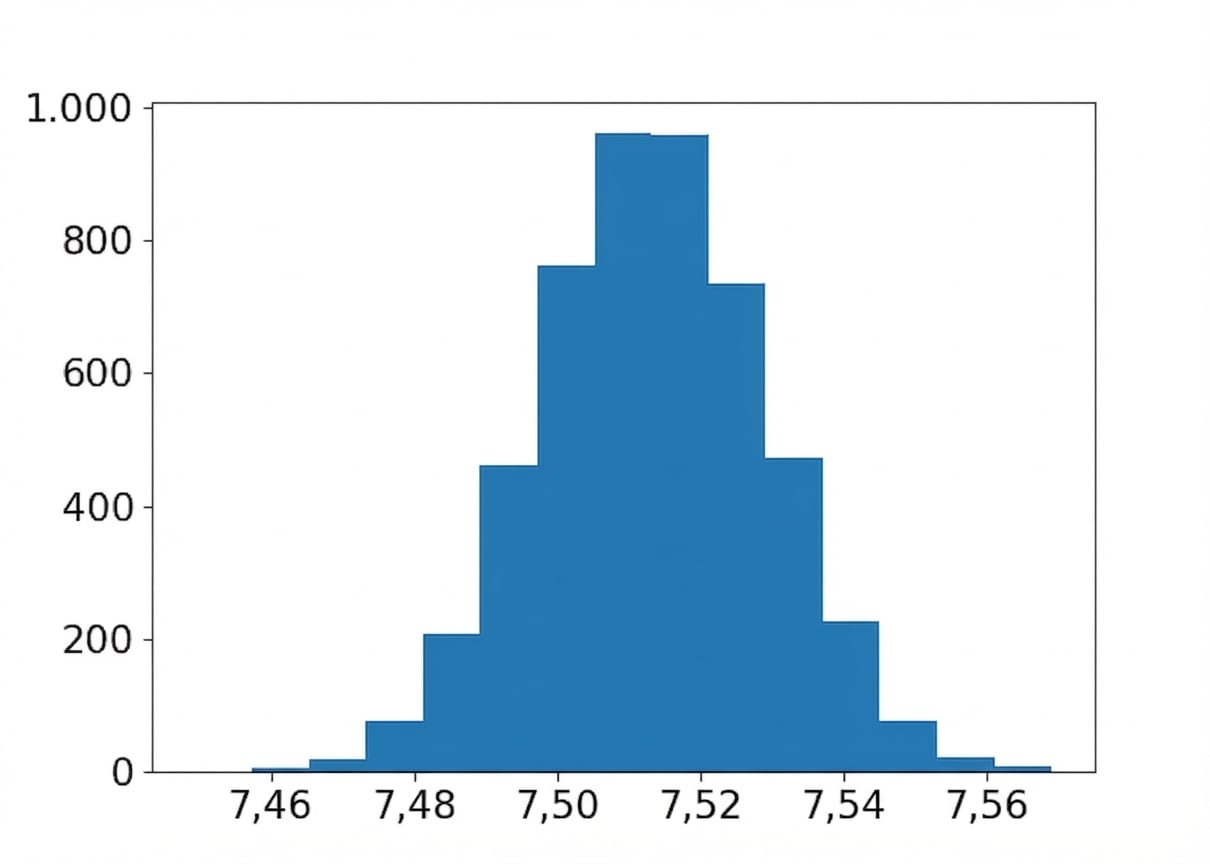
Media de las remuestras
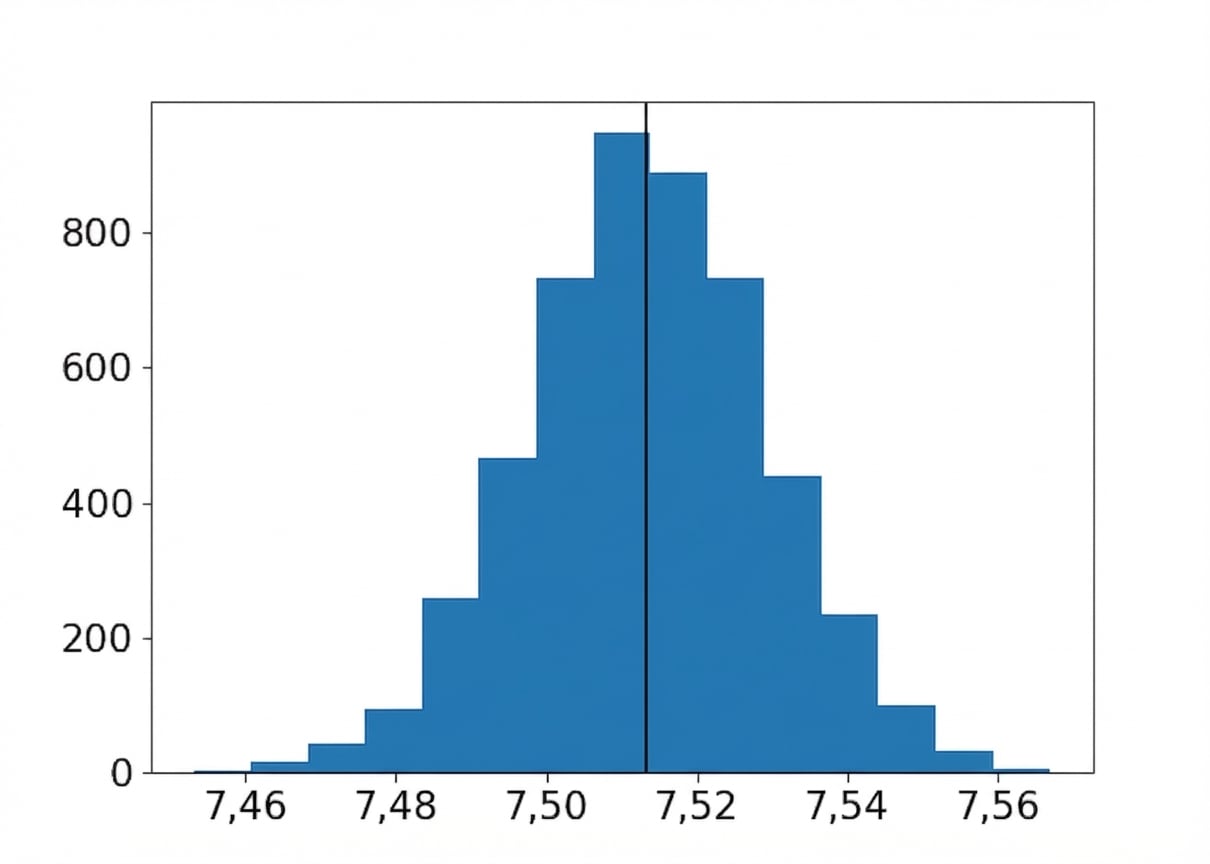
Media ± una desviación estándar
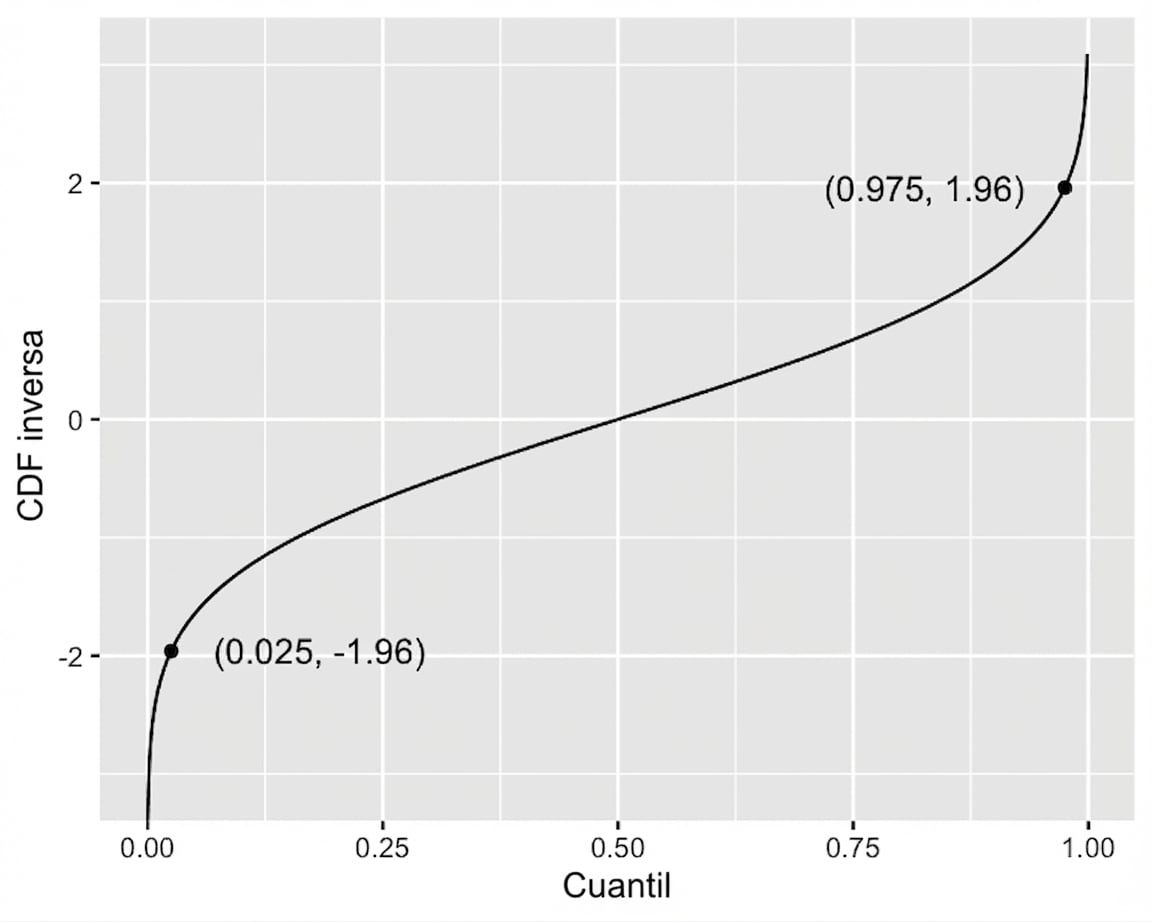
Método de cuantiles para intervalos de confianza
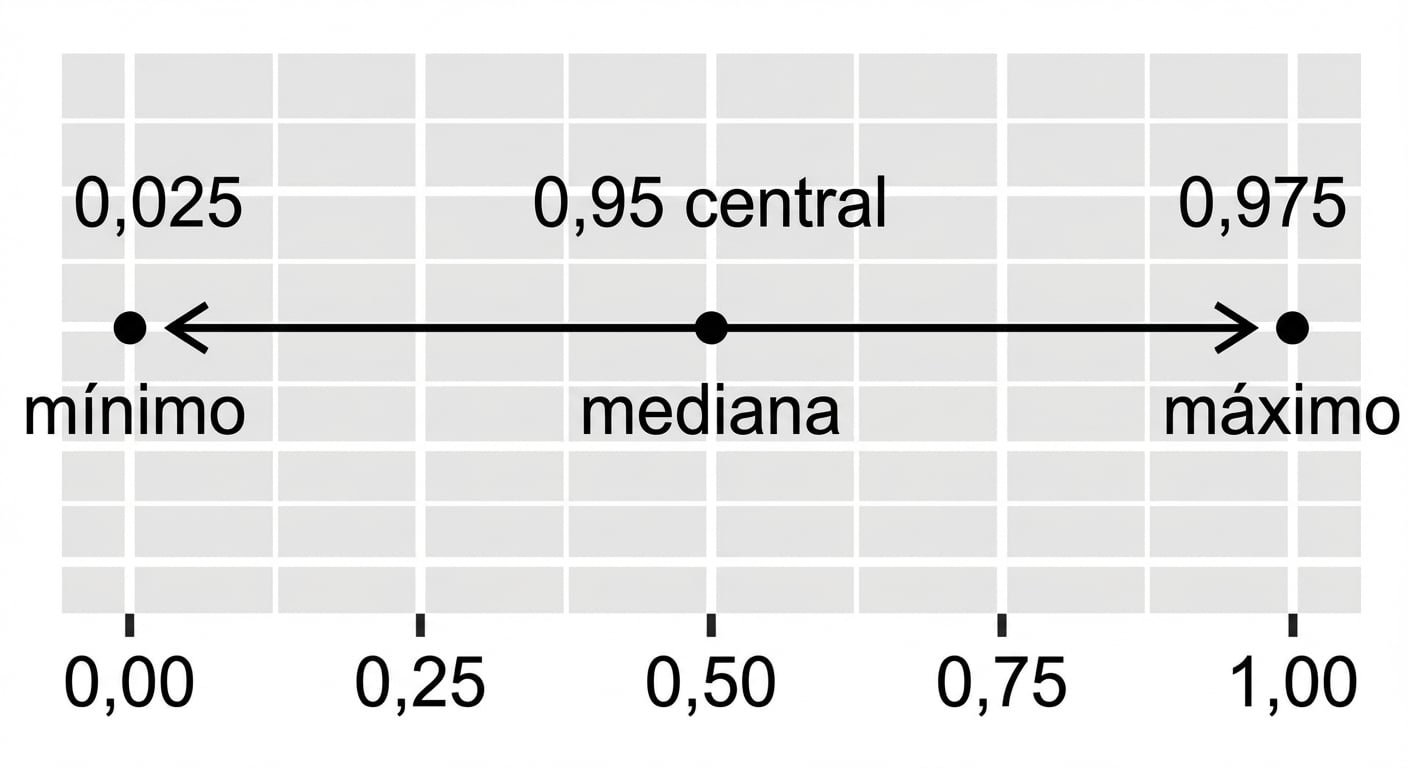
Función de distribución acumulada inversa