Introducción a los arrays
Introducción a NumPy

Izzy Weber
Core Curriculum Manager, DataCamp
NumPy y el ecosistema de Python

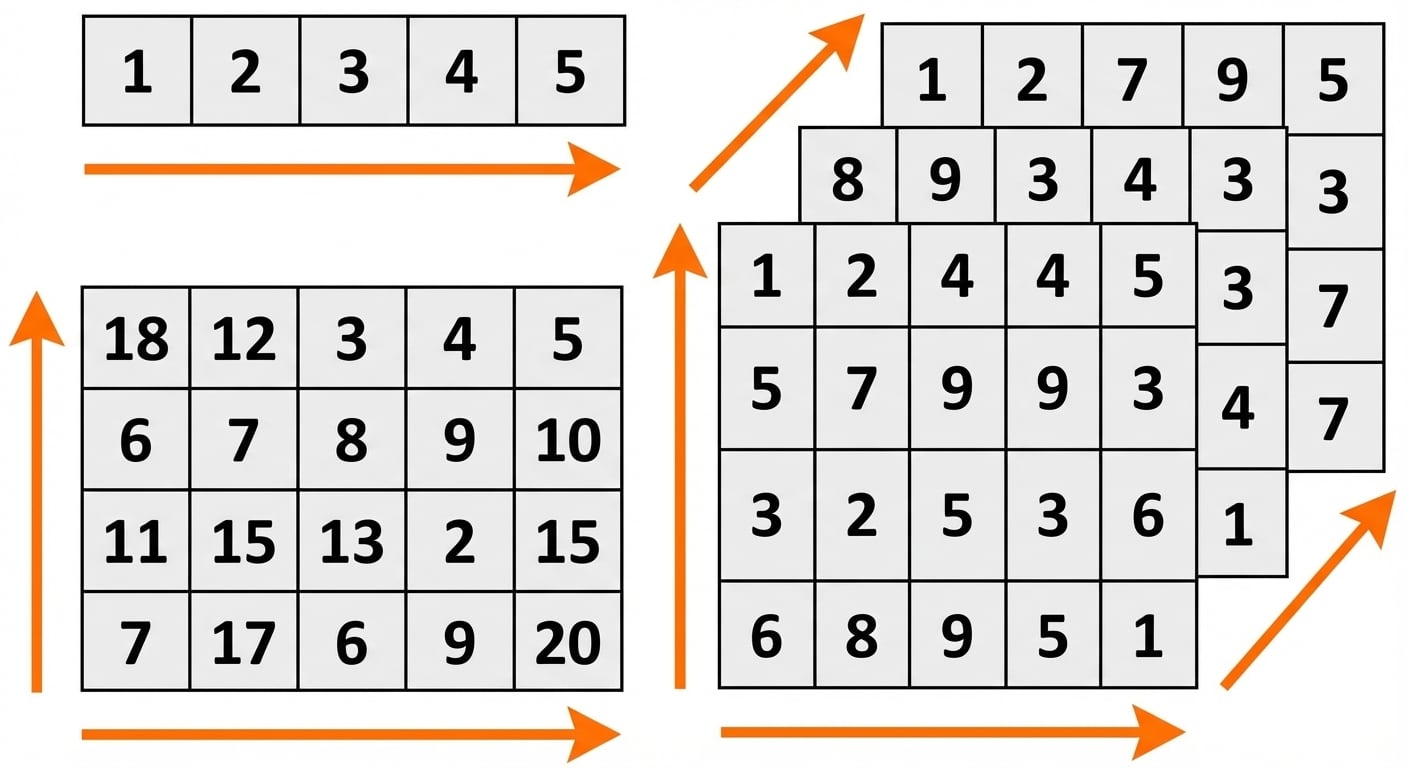
Arrays de NumPy
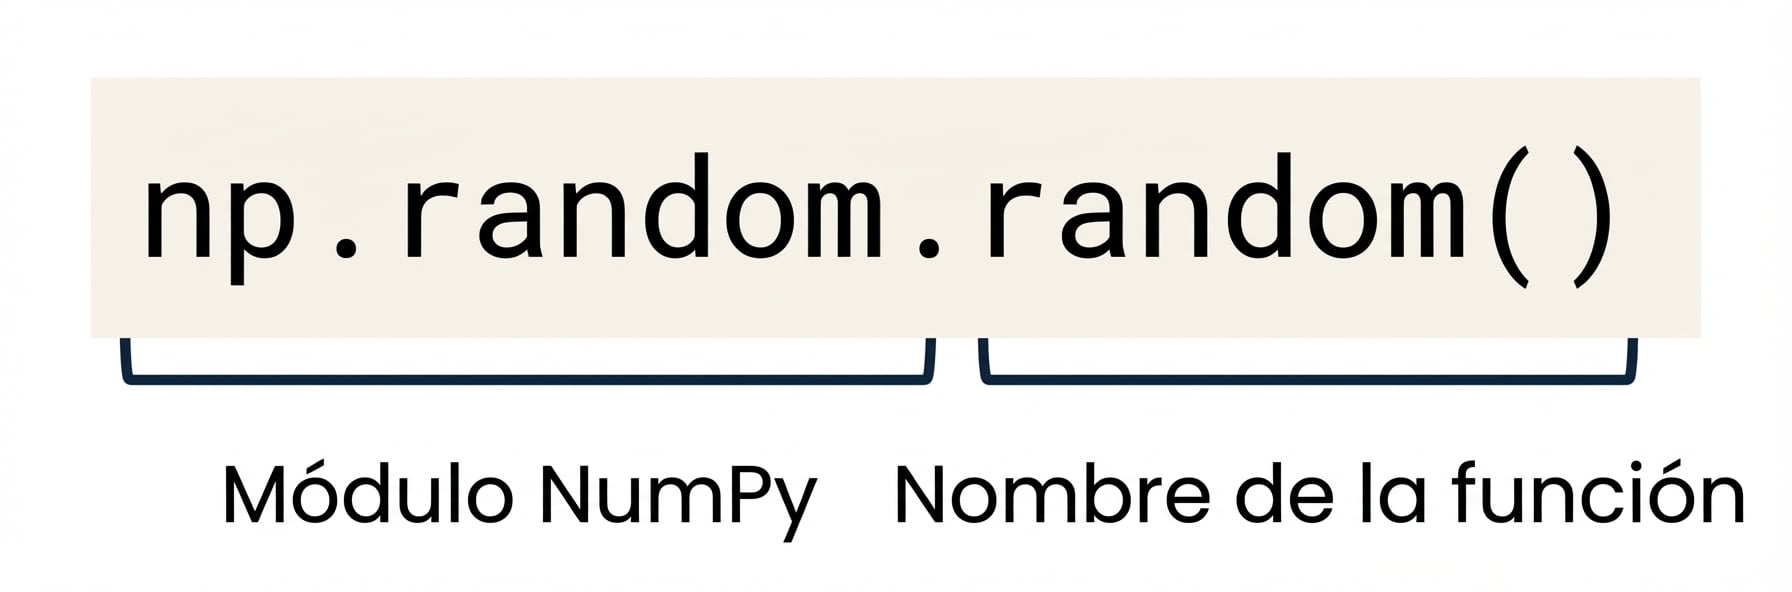
Crear arrays: np.random.random()
np.random.random((2, 4))
array([[0.88524516, 0.85641352, 0.33463107, 0.53337117],
       [0.69933362, 0.09295327, 0.93616428, 0.03601592]])
Crear arrays con np.arange()
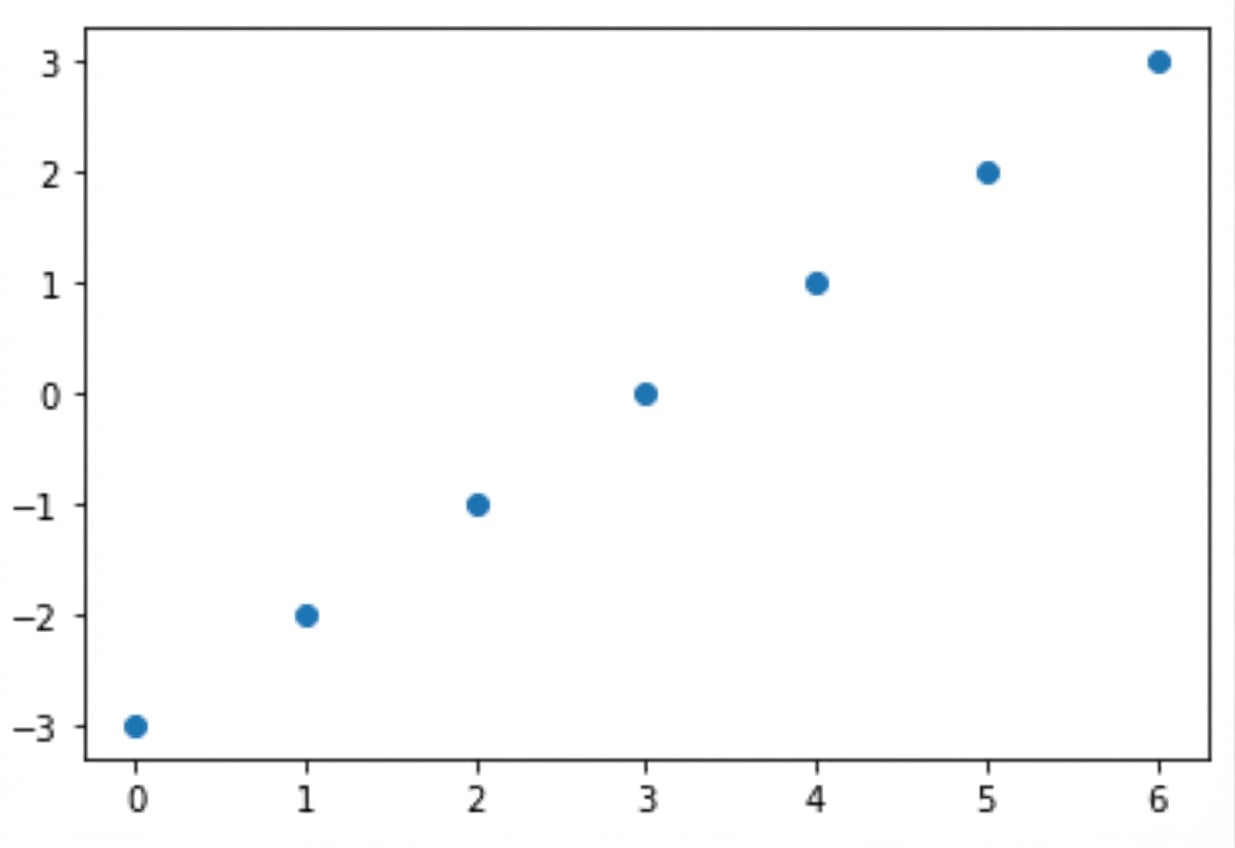
from matplotlib import pyplot as plt
plt.scatter(np.arange(0, 7),
            np.arange(-3, 4))
plt.show()