Resumir datos
Introducción a NumPy

Izzy Weber
Core Curriculum Manager, DataCamp
Nuestros datos

Sumar datos
Agregar filas

Agregar columnas

Cómo entender el argumento axis

Valores mínimo y máximo
Calcular la media
Sumas acumuladas
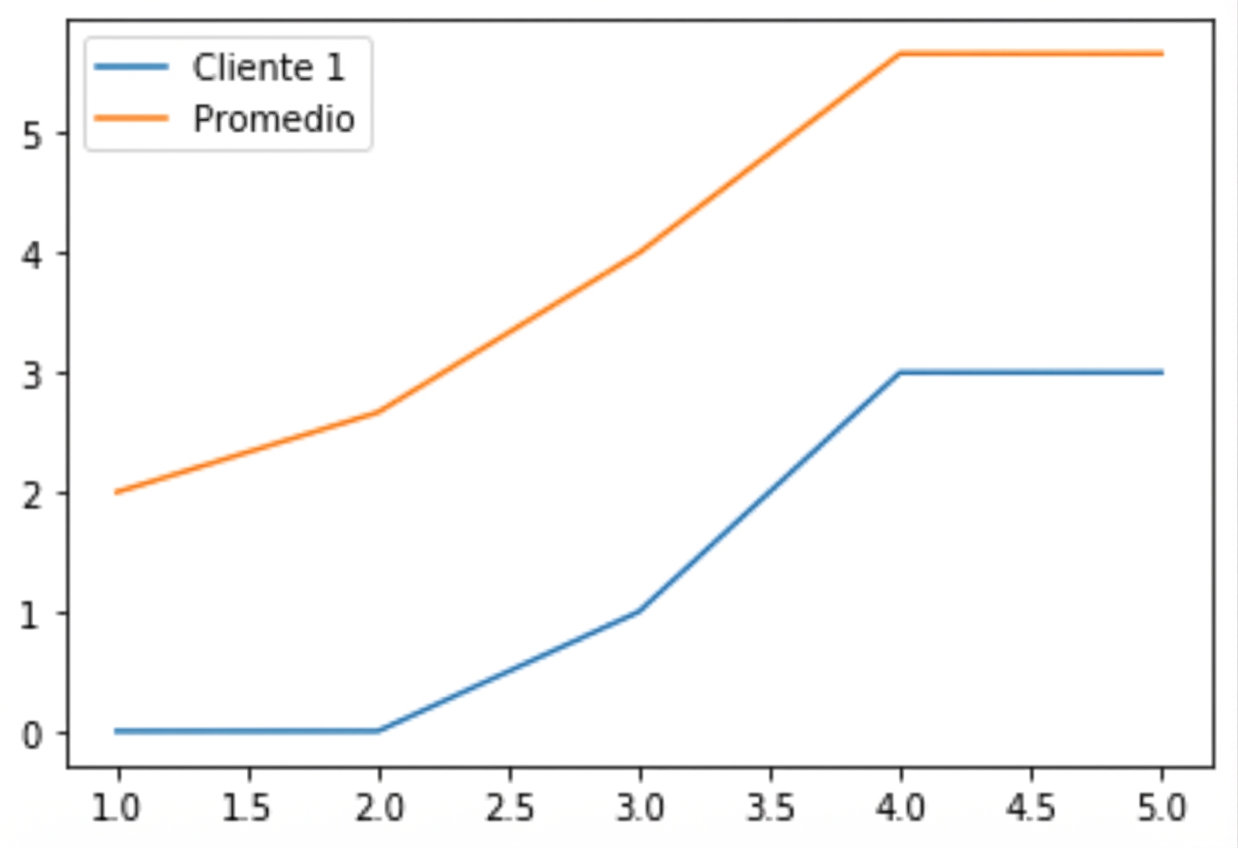
Graficar valores resumen
cum_sums_by_client = security_breaches.cumsum(axis=0)
plt.plot(np.arange(1, 6), cum_sums_by_client[:, 0], label="Client 1")
plt.plot(np.arange(1, 6), cum_sums_by_client.mean(axis=1), label="Average")
plt.legend()
plt.show()