Identificar problemas de rendimiento
Modelado de datos intermedio en Power BI

Sara Billen
Curriculum Manager at DataCamp
Resolver problemas de rendimiento

Problemas de rendimiento

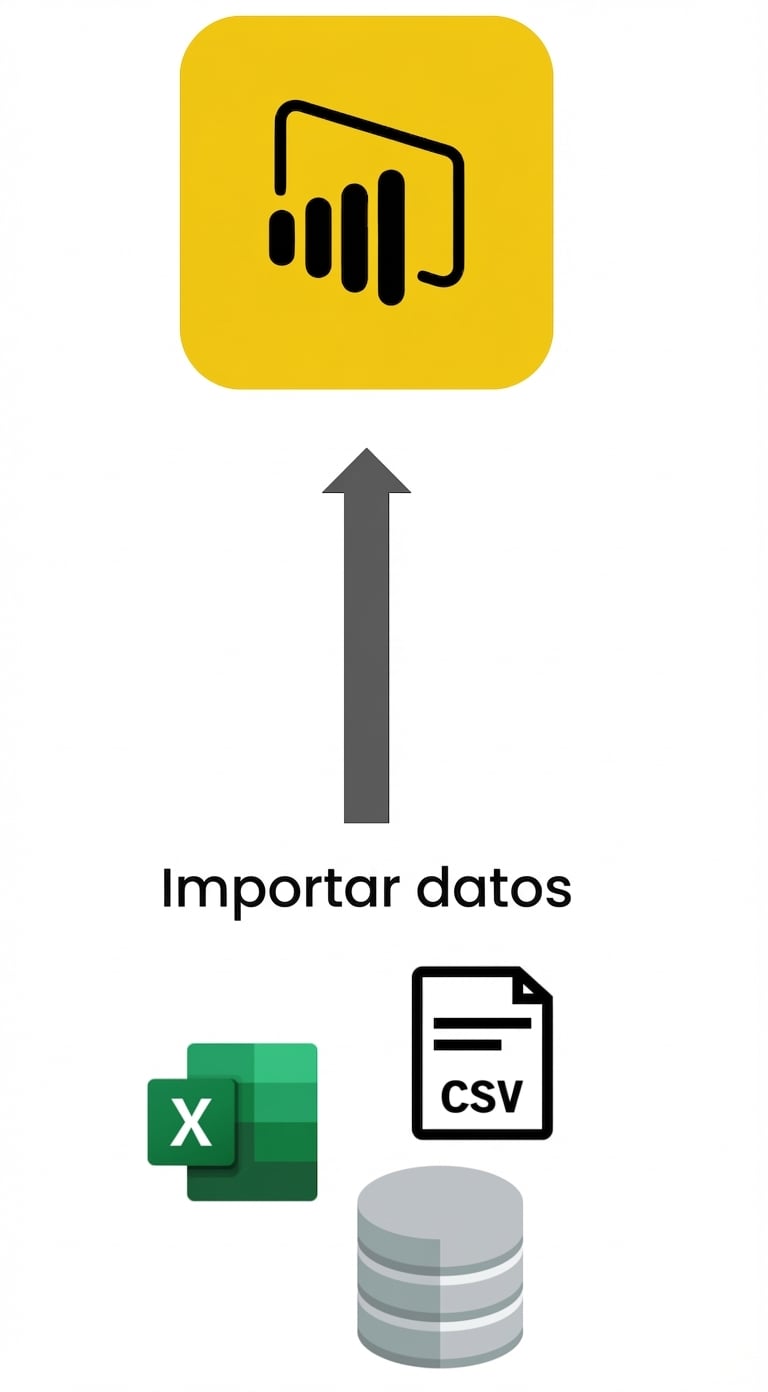
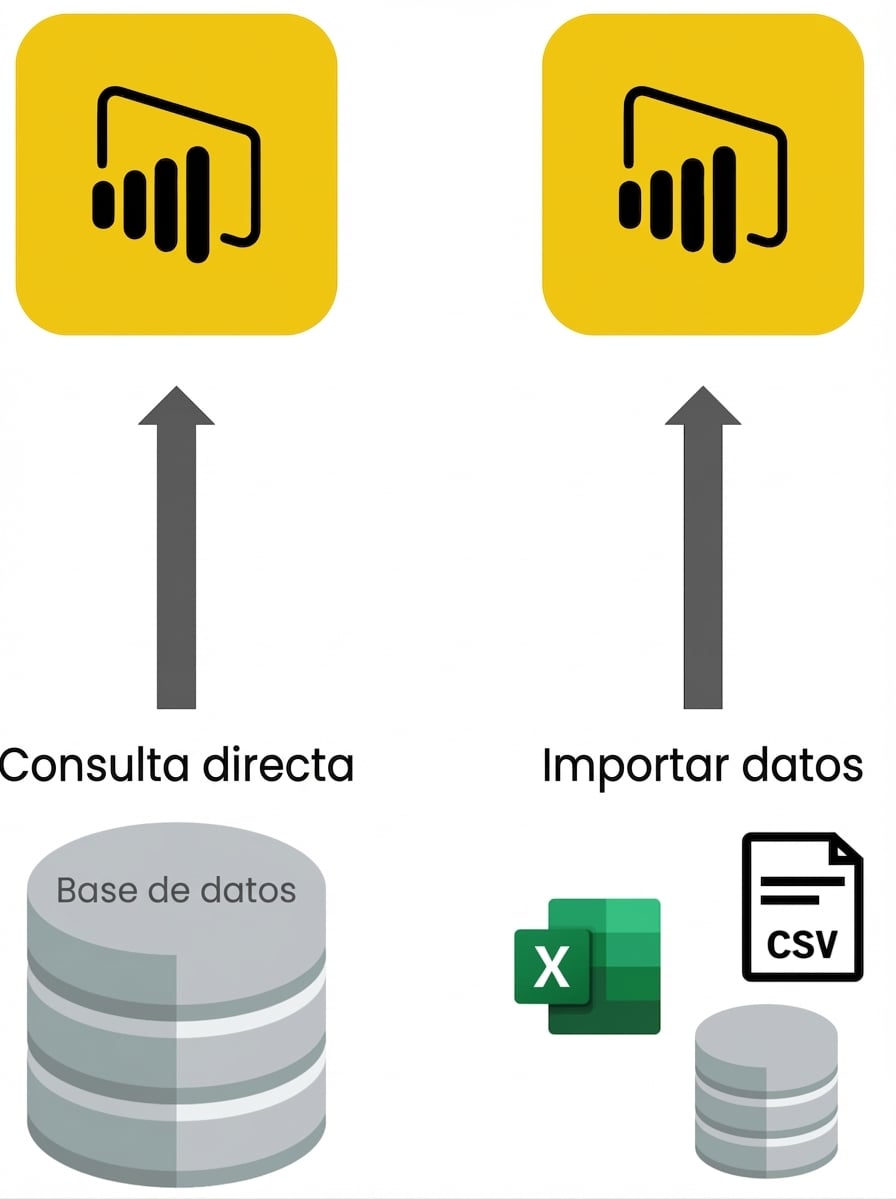
Optimizar la importación de datos
Optimizar Direct Query
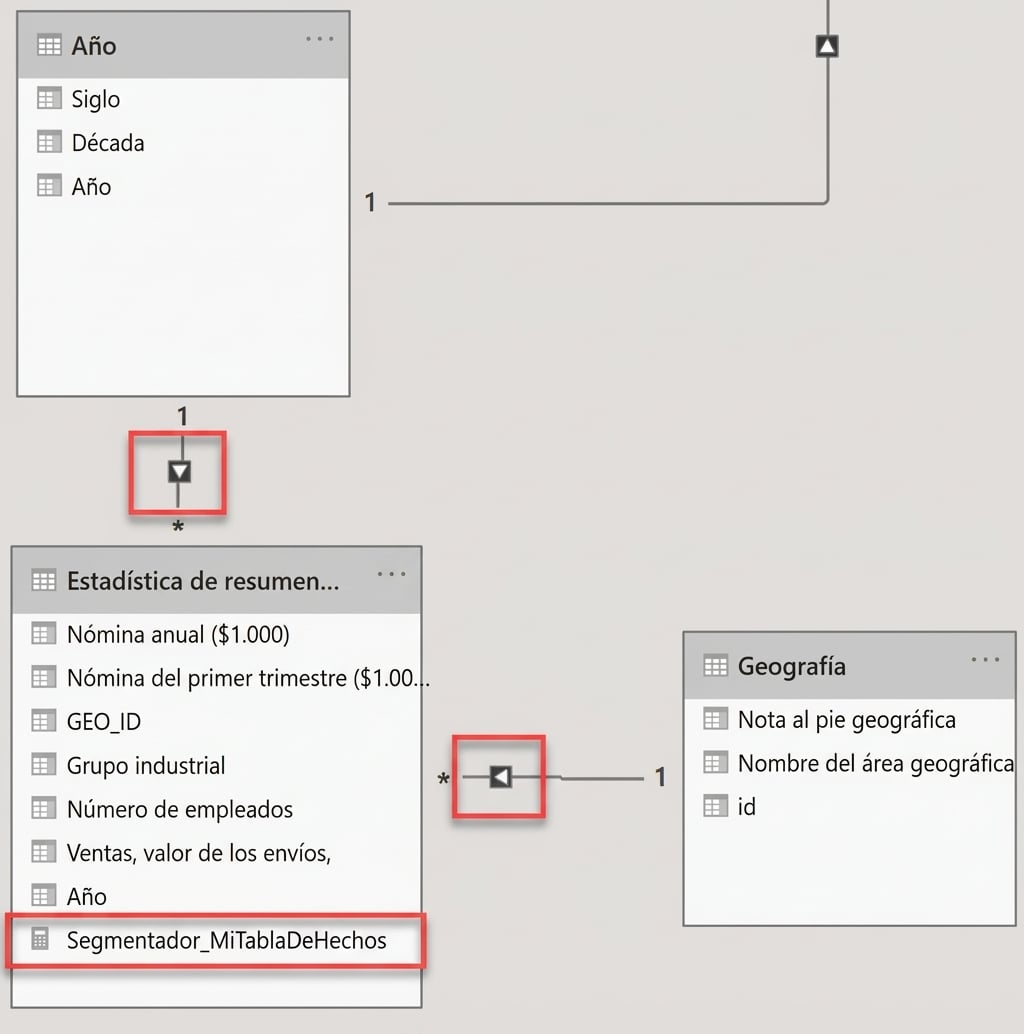
Quitar el filtrado bidireccional con medidas de filtro
Mostrar visuales