Distribuciones y valores atípicos
Análisis exploratorio de datos en Power BI

Jacob H. Marquez
Data Scientist at Microsoft
¿Qué son los histogramas?
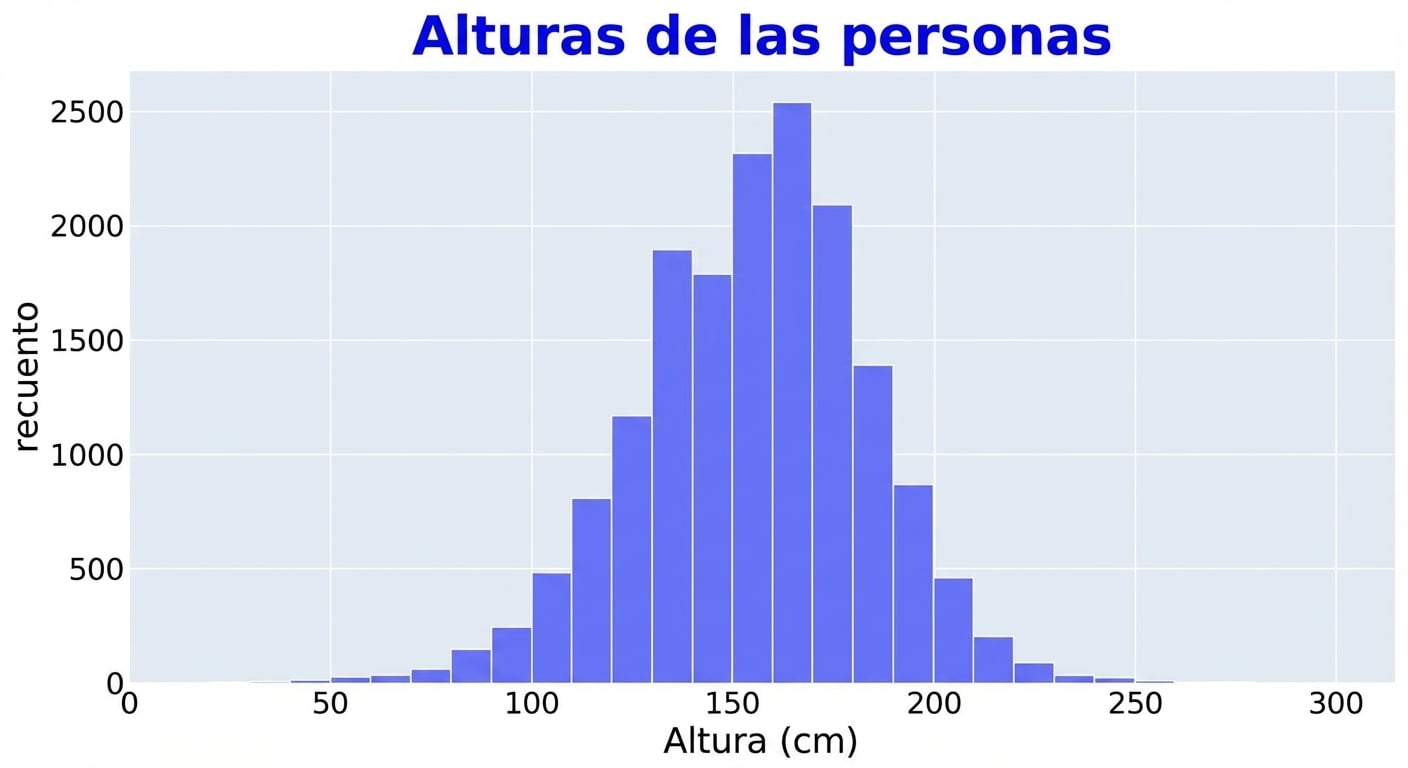
¿Qué son los histogramas? - bins
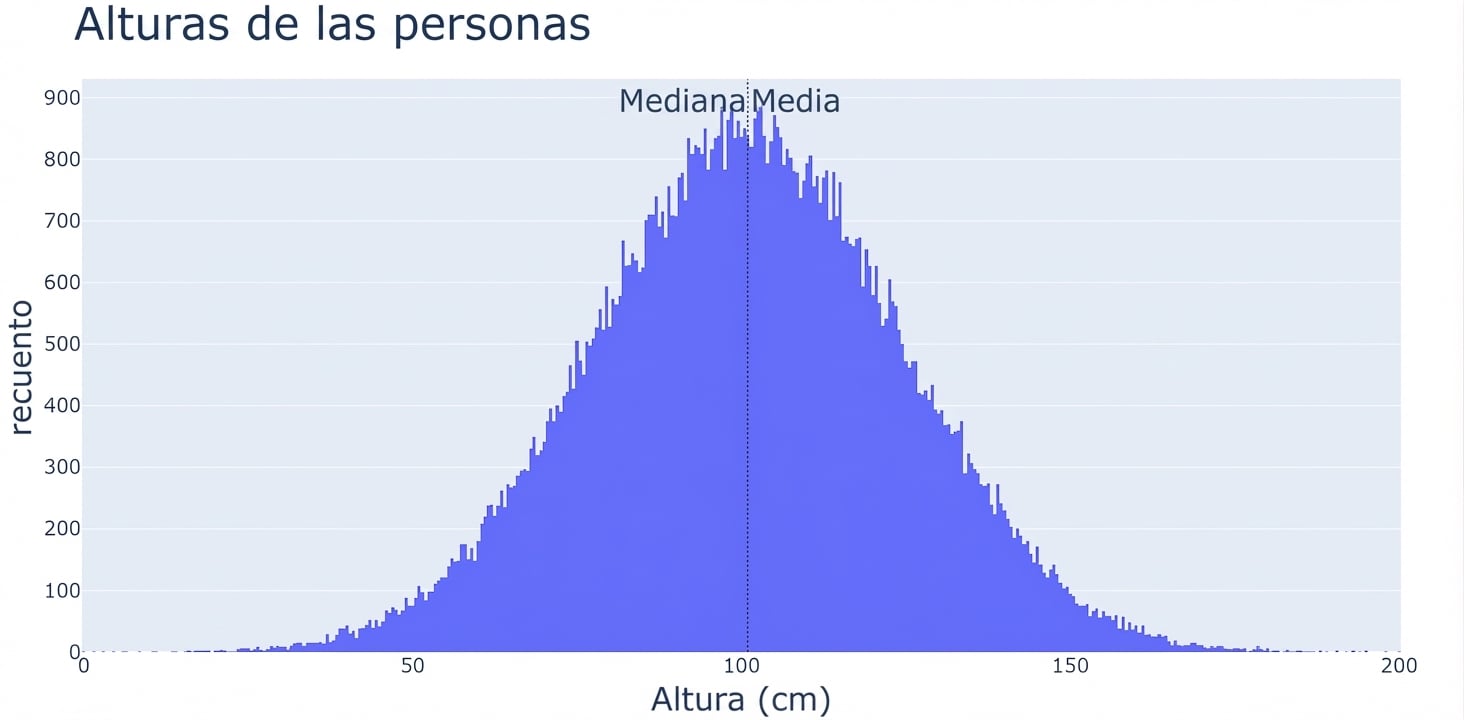
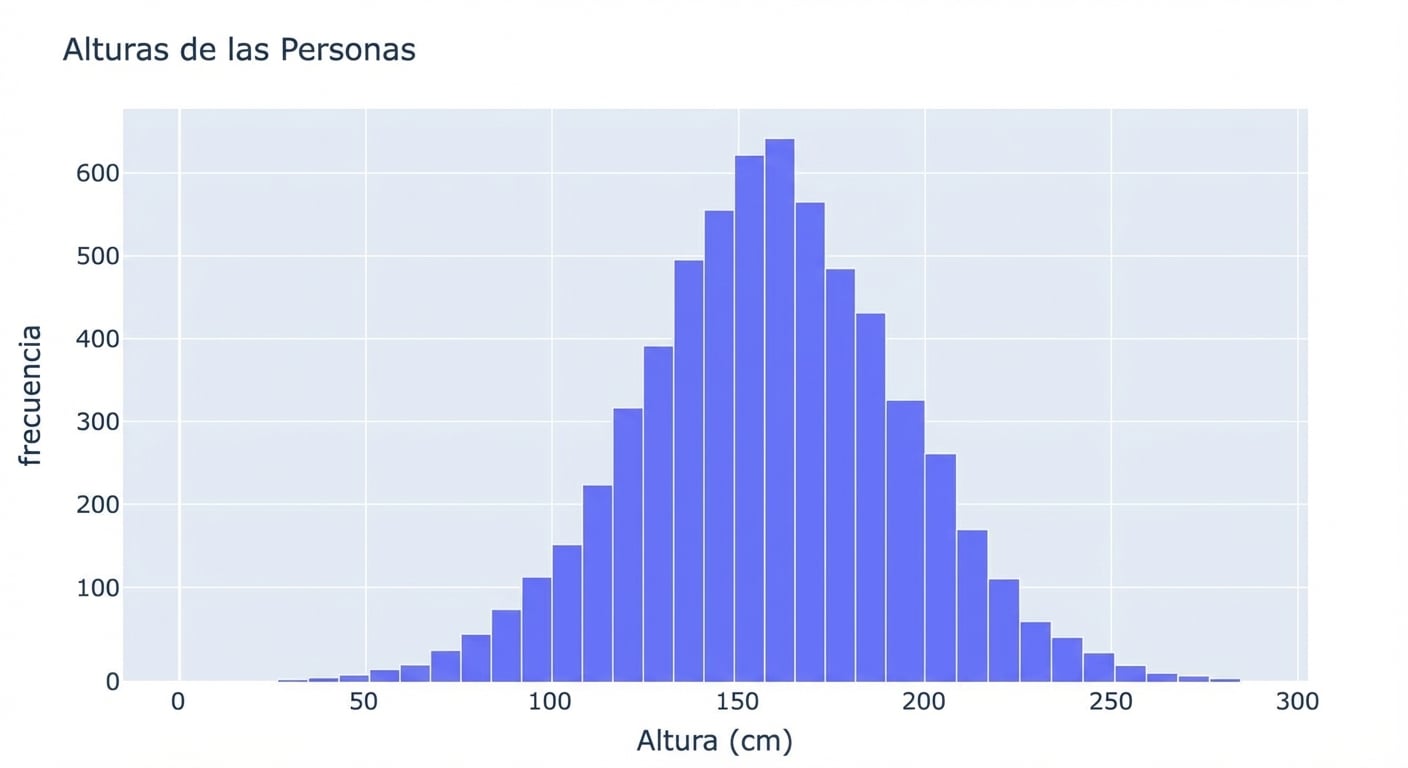
Histograma con 100 bins
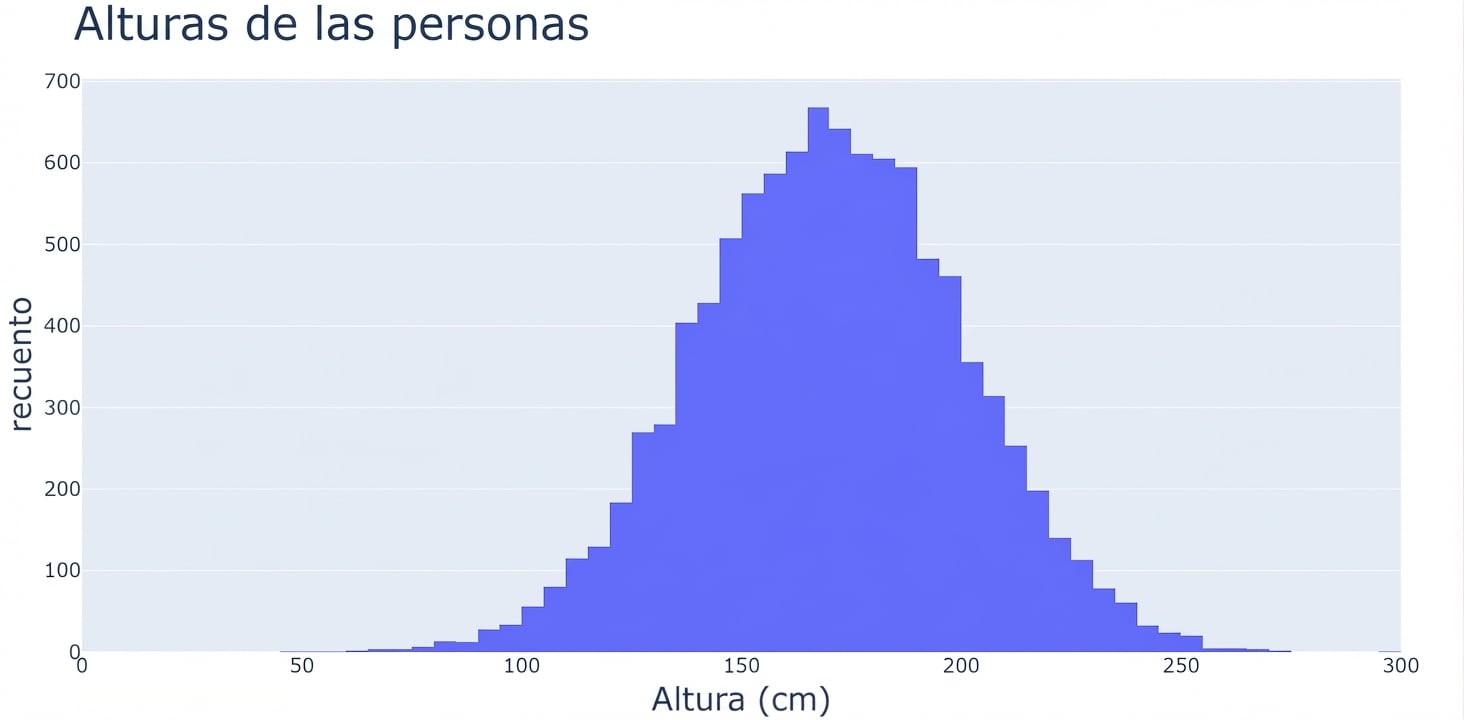
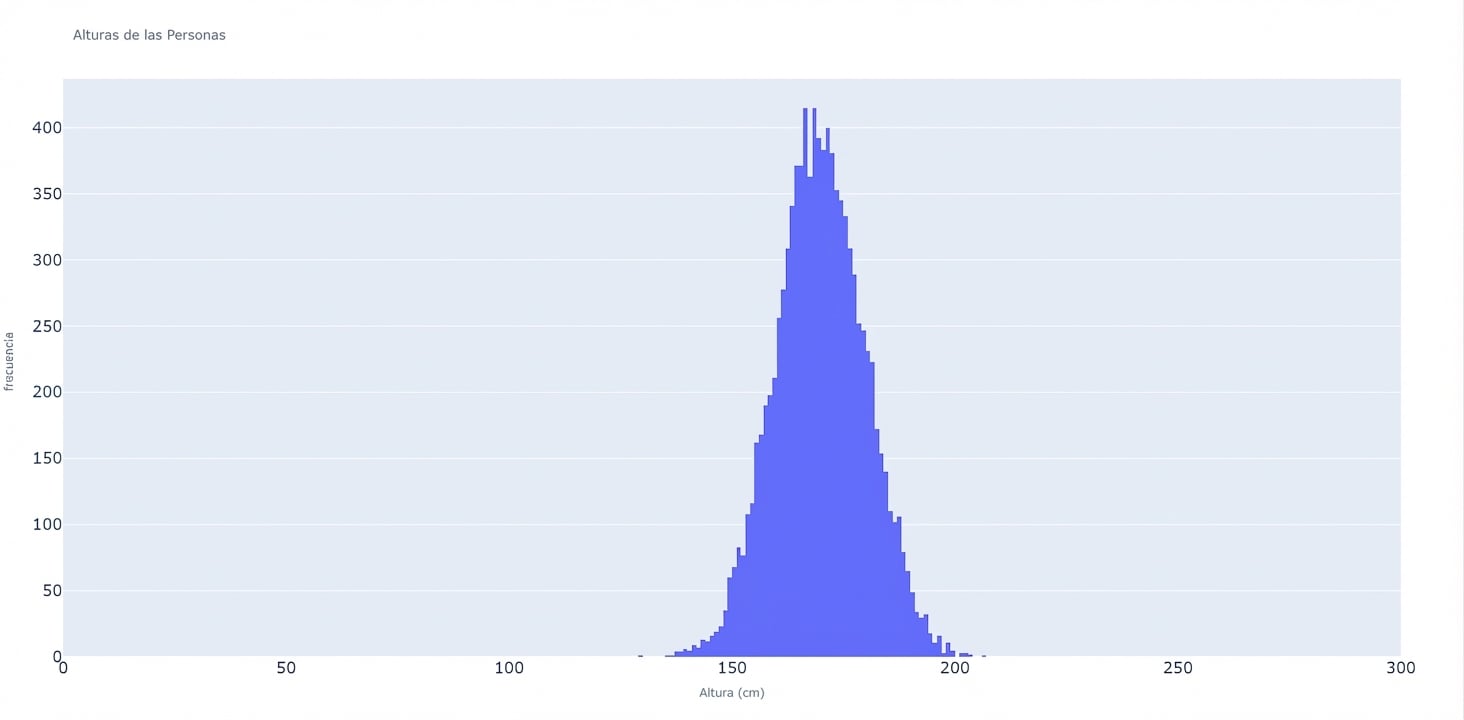
Histograma con 20 bins
Leer histogramas: centralidad y sesgo
Distribución normal
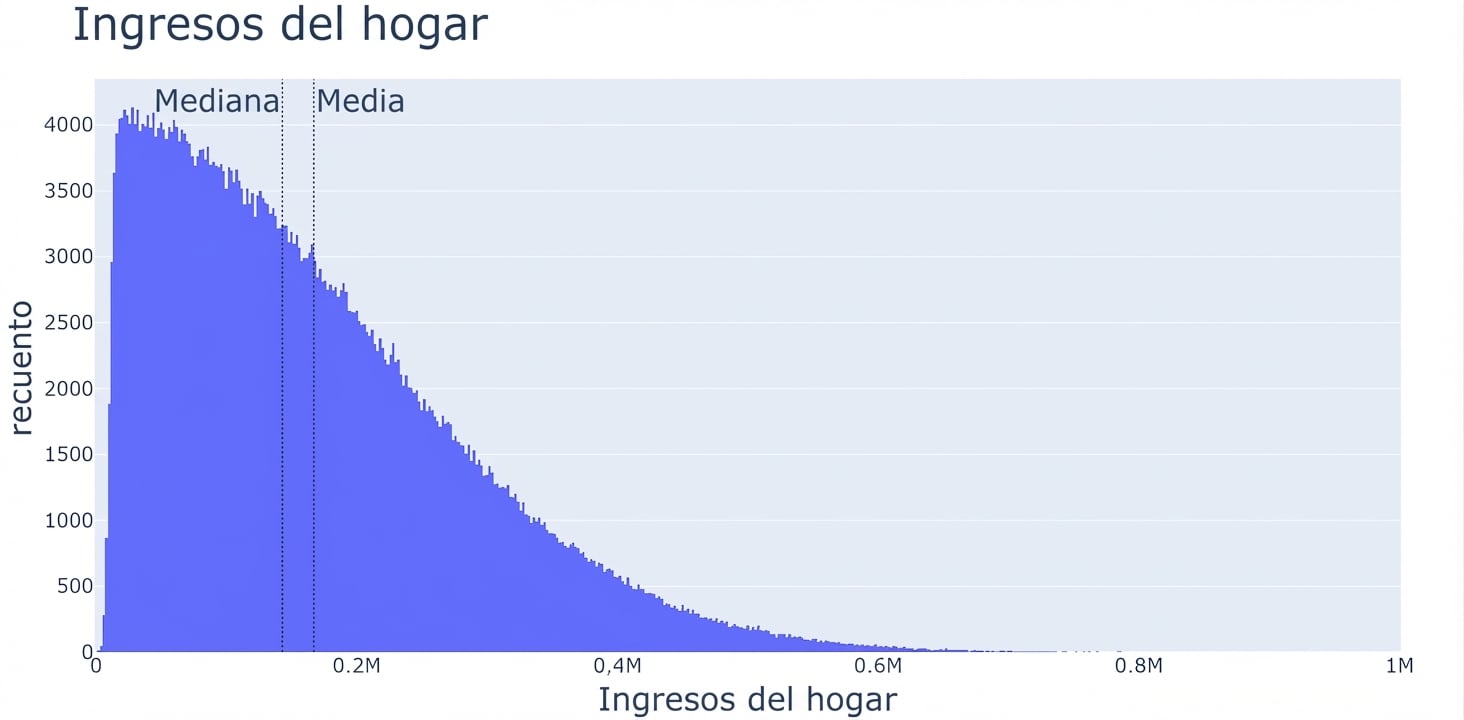
Distribución sesgada a la derecha
Leer histogramas: dispersión
Desviación estándar mayor
Desviación estándar menor
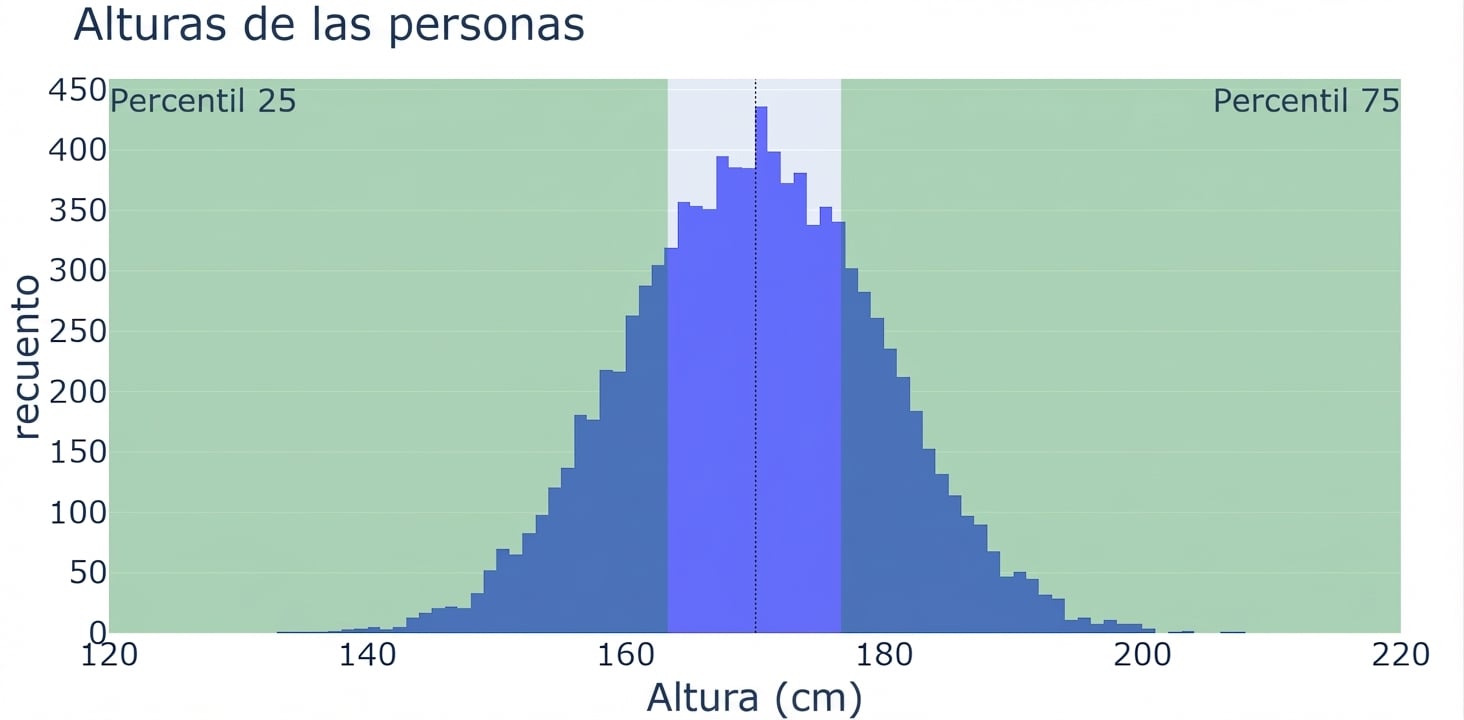
Leer histogramas: percentiles
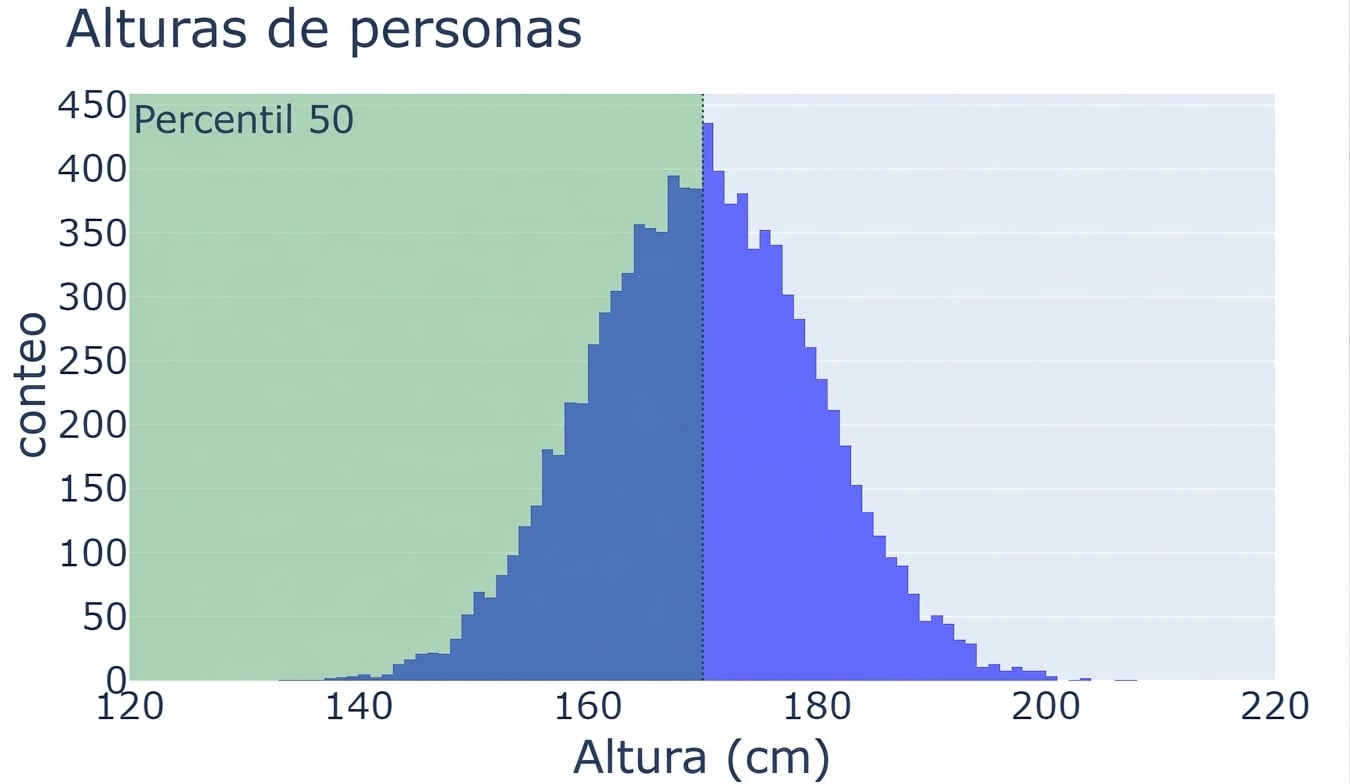
Leer histogramas: percentiles 25 y 75
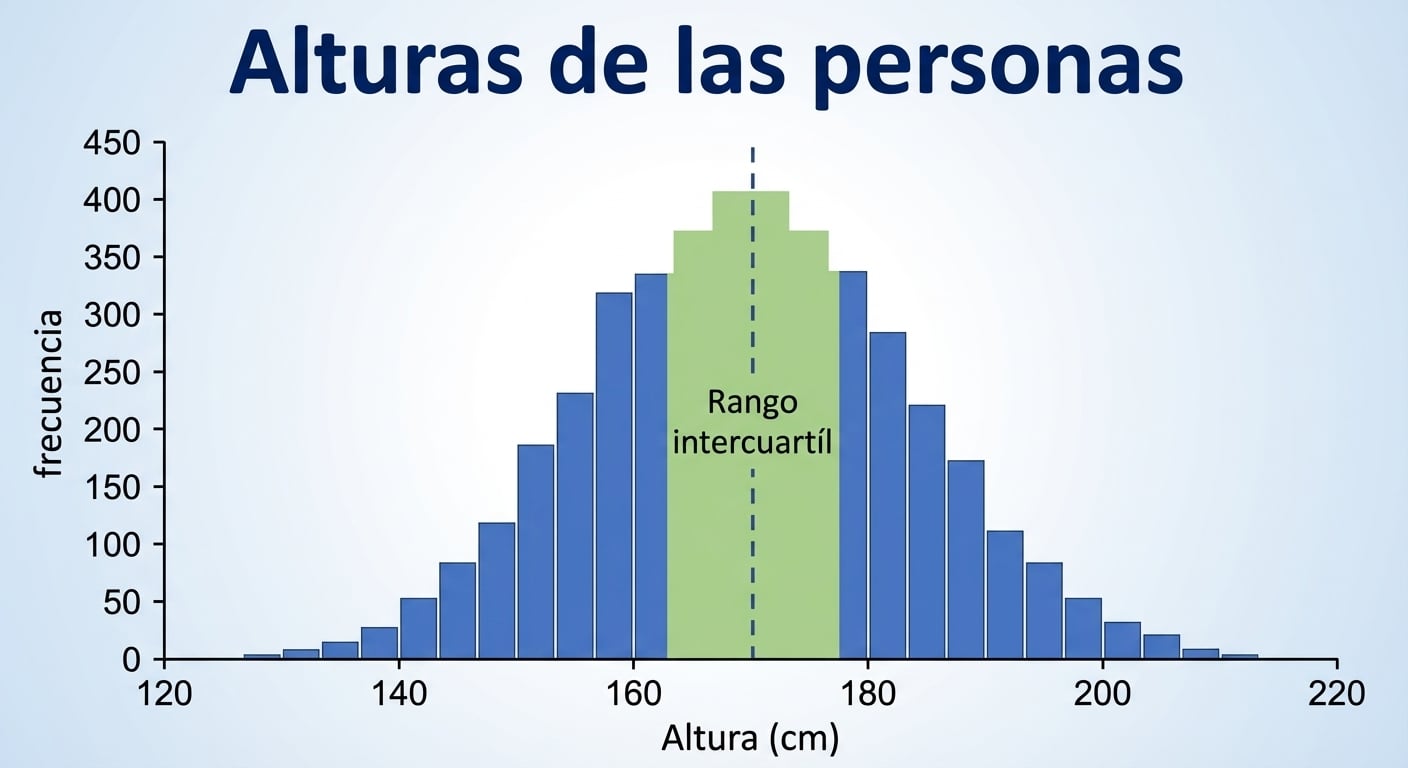
Leer histogramas: rango intercuartílico
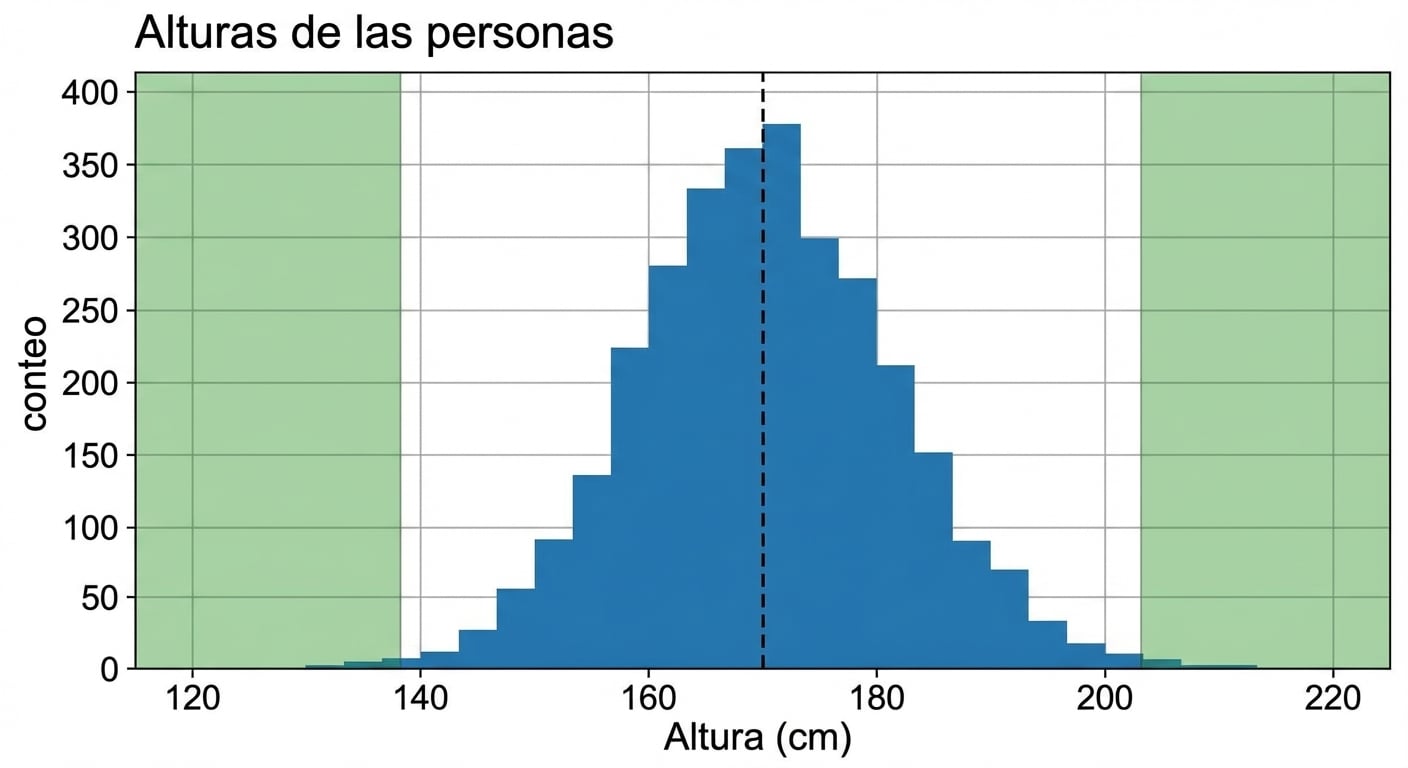
¿Qué es un valor atípico?