Cluster Analysis in Python
Shaumik Daityari
Business Analyst
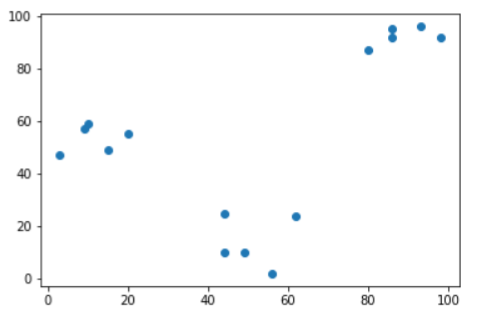
Data with no labels
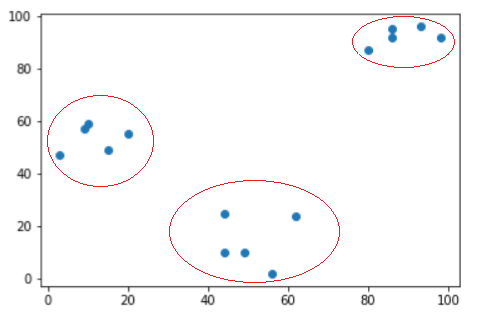
Data with labels
from matplotlib import pyplot as plt
x_coordinates = [80, 93, 86, 98, 86, 9, 15, 3, 10, 20, 44, 56, 49, 62, 44]
y_coordinates = [87, 96, 95, 92, 92, 57, 49, 47, 59, 55, 25, 2, 10, 24, 10]
plt.scatter(x_coordinates, y_coordinates)
plt.show()