Understanding Bayesian methods

Supervised Learning in R: Classification

Brett Lantz

Instructor

Estimating probability

Location Map

The probability of A is denoted P(A)

  • P(work) = 23 / 40 = 57.5%
  • P(store) = 4 / 40 = 10.0%
Supervised Learning in R: Classification

Joint probability and independent events

Venn Diagrams

The joint probability of events A and B is denoted P(A and B)

  • P(work and evening) = 1%
  • P(work and afternoon) = 20%
Supervised Learning in R: Classification

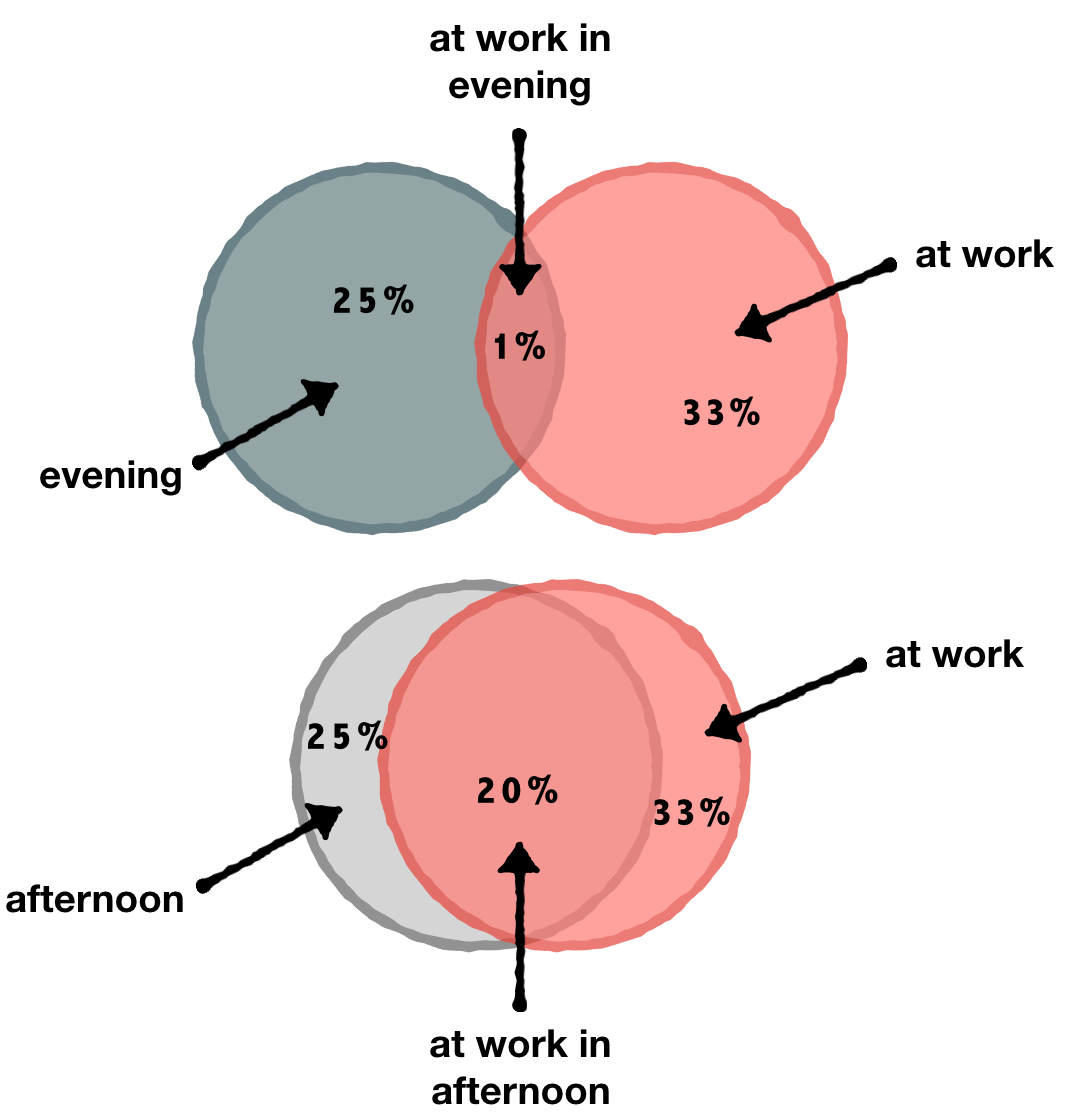
Conditional probability and dependent events

Venn Diagrams

The conditional probability of events A and B is denoted P(A | B)

  • P(A | B) = P(A and B) / P(B)
  • P(work | evening) = 1 / 25 = 4%
  • P(work | afternoon) = 20 / 25 = 80%
Supervised Learning in R: Classification

Making predictions with Naive Bayes

# building a Naive Bayes model
library(naivebayes)
m <- naive_bayes(location ~ time_of_day, data = location_history)
# making predictions with Naive Bayes
future_location <- predict(m, future_conditions)
Supervised Learning in R: Classification

Let's practice!

Supervised Learning in R: Classification

Preparing Video For Download...