Downsampling & aggregation

Manipulating Time Series Data in Python

Stefan Jansen

Founder & Lead Data Scientist at Applied Artificial Intelligence
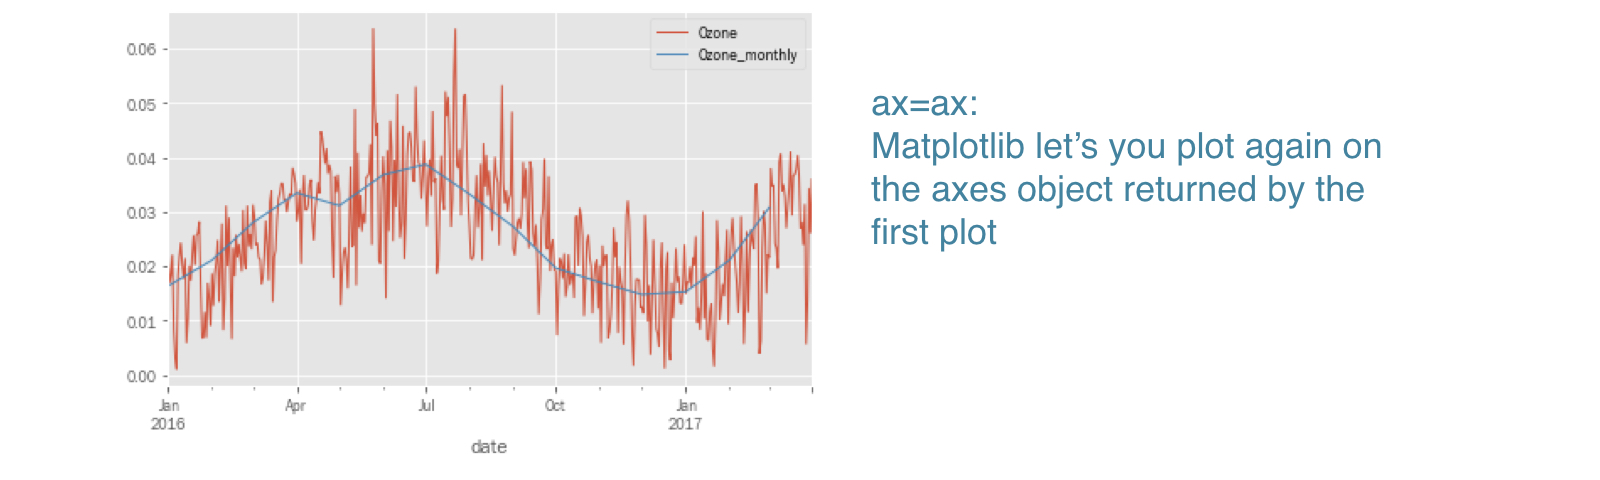
Downsampling & aggregation methods

  • So far: upsampling, fill logic & interpolation
  • Now: downsampling
    • hour to day
    • day to month, etc
  • How to represent the existing values at the new date?
    • Mean, median, last value?
Manipulating Time Series Data in Python

Air quality: daily ozone levels

ozone = pd.read_csv('ozone.csv',
                     parse_dates=['date'],
                     index_col='date')

ozone.info()
DatetimeIndex: 6291 entries, 2000-01-01 to 2017-03-31
Data columns (total 1 columns):
Ozone    6167 non-null float64
dtypes: float64(1)
ozone = ozone.resample('D').asfreq()

ozone.info()
DatetimeIndex: 6300 entries, 1998-01-05 to 2017-03-31
Freq: D
Data columns (total 1 columns):
Ozone    6167 non-null float64
dtypes: float64(1)
Manipulating Time Series Data in Python

Creating monthly ozone data

ozone.resample('M').mean().head()
               Ozone
date
2000-01-31  0.010443
2000-02-29  0.011817
2000-03-31  0.016810
2000-04-30  0.019413
2000-05-31  0.026535

.resample().mean(): Monthly average, assigned to end of calendar month

ozone.resample('M').median().head()
               Ozone
date
2000-01-31  0.009486
2000-02-29  0.010726
2000-03-31  0.017004
2000-04-30  0.019866
2000-05-31  0.026018
Manipulating Time Series Data in Python

Creating monthly ozone data

ozone.resample('M').agg(['mean', 'std']).head()
               Ozone
                mean       std
date
2000-01-31  0.010443  0.004755
2000-02-29  0.011817  0.004072
2000-03-31  0.016810  0.004977
2000-04-30  0.019413  0.006574
2000-05-31  0.026535  0.008409
  • .resample().agg(): List of aggregation functions like groupby
Manipulating Time Series Data in Python

Plotting resampled ozone data

ozone = ozone.loc['2016':]

ax = ozone.plot()
monthly = ozone.resample('M').mean()
monthly.add_suffix('_monthly').plot(ax=ax)

ch2_4_v2 - Downsampling & Aggregation.018.png

Manipulating Time Series Data in Python

Resampling multiple time series

data = pd.read_csv('ozone_pm25.csv',
                   parse_dates=['date'],
                   index_col='date')

data = data.resample('D').asfreq()
data.info()
DatetimeIndex: 6300 entries, 2000-01-01 to 2017-03-31
Freq: D
Data columns (total 2 columns):
Ozone    6167 non-null float64
PM25     6167 non-null float64
dtypes: float64(2)
Manipulating Time Series Data in Python

Resampling multiple time series

data = data.resample('BM').mean()

data.info()
<class 'pandas.core.frame.DataFrame'>
DatetimeIndex: 207 entries, 2000-01-31 to 2017-03-31
Freq: BM
Data columns (total 2 columns):
ozone    207 non-null float64
pm25     207 non-null float64
dtypes: float64(2)
Manipulating Time Series Data in Python

Resampling multiple time series

df.resample('M').first().head(4)
               Ozone       PM25
date
2000-01-31  0.005545  20.800000
2000-02-29  0.016139   6.500000
2000-03-31  0.017004   8.493333
2000-04-30  0.031354   6.889474
df.resample('MS').first().head()
               Ozone       PM25
date
2000-01-01  0.004032  37.320000
2000-02-01  0.010583  24.800000
2000-03-01  0.007418  11.106667
2000-04-01  0.017631  11.700000
2000-05-01  0.022628   9.700000
Manipulating Time Series Data in Python

Let's practice!

Manipulating Time Series Data in Python

Preparing Video For Download...