Manipulación de series temporales en Python
Stefan Jansen
Founder & Lead Data Scientist at Applied Artificial Intelligence
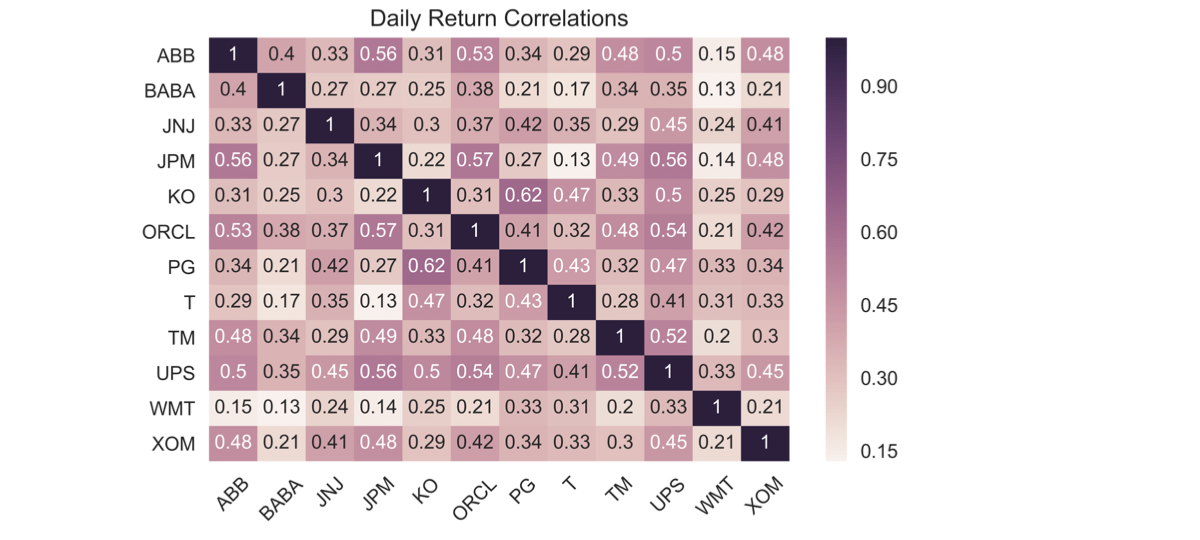
Correlaciones de rendimientos diarios:
Calcula entre todos los componentes
Visualiza el resultado como mapa de calor
Escribe resultados a Excel en formatos .xls y .xlsx:
Una sola hoja
Varias hojas
data = DataReader(tickers, 'google', start='2016', end='2017')['Close']data.info()
DatetimeIndex: 252 entries, 2016-01-04 to 2016-12-30
Data columns (total 12 columns):
ABB 252 non-null float64
BABA 252 non-null float64
JNJ 252 non-null float64
JPM 252 non-null float64
KO 252 non-null float64
ORCL 252 non-null float64
PG 252 non-null float64
T 252 non-null float64
TM 252 non-null float64
UPS 252 non-null float64
WMT 252 non-null float64
XOM 252 non-null float64
daily_returns = data.pct_change()correlations = daily_returns.corr()
ABB BABA JNJ JPM KO ORCL PG T TM UPS WMT XOM
ABB 1.00 0.40 0.33 0.56 0.31 0.53 0.34 0.29 0.48 0.50 0.15 0.48
BABA 0.40 1.00 0.27 0.27 0.25 0.38 0.21 0.17 0.34 0.35 0.13 0.21
JNJ 0.33 0.27 1.00 0.34 0.30 0.37 0.42 0.35 0.29 0.45 0.24 0.41
JPM 0.56 0.27 0.34 1.00 0.22 0.57 0.27 0.13 0.49 0.56 0.14 0.48
KO 0.31 0.25 0.30 0.22 1.00 0.31 0.62 0.47 0.33 0.50 0.25 0.29
ORCL 0.53 0.38 0.37 0.57 0.31 1.00 0.41 0.32 0.48 0.54 0.21 0.42
PG 0.34 0.21 0.42 0.27 0.62 0.41 1.00 0.43 0.32 0.47 0.33 0.34
T 0.29 0.17 0.35 0.13 0.47 0.32 0.43 1.00 0.28 0.41 0.31 0.33
TM 0.48 0.34 0.29 0.49 0.33 0.48 0.32 0.28 1.00 0.52 0.20 0.30
UPS 0.50 0.35 0.45 0.56 0.50 0.54 0.47 0.41 0.52 1.00 0.33 0.45
WMT 0.15 0.13 0.24 0.14 0.25 0.21 0.33 0.31 0.20 0.33 1.00 0.21
XOM 0.48 0.21 0.41 0.48 0.29 0.42 0.34 0.33 0.30 0.45 0.21 1.00
sns.heatmap(correlations, annot=True)
plt.xticks(rotation=45)
plt.title('Daily Return Correlations')
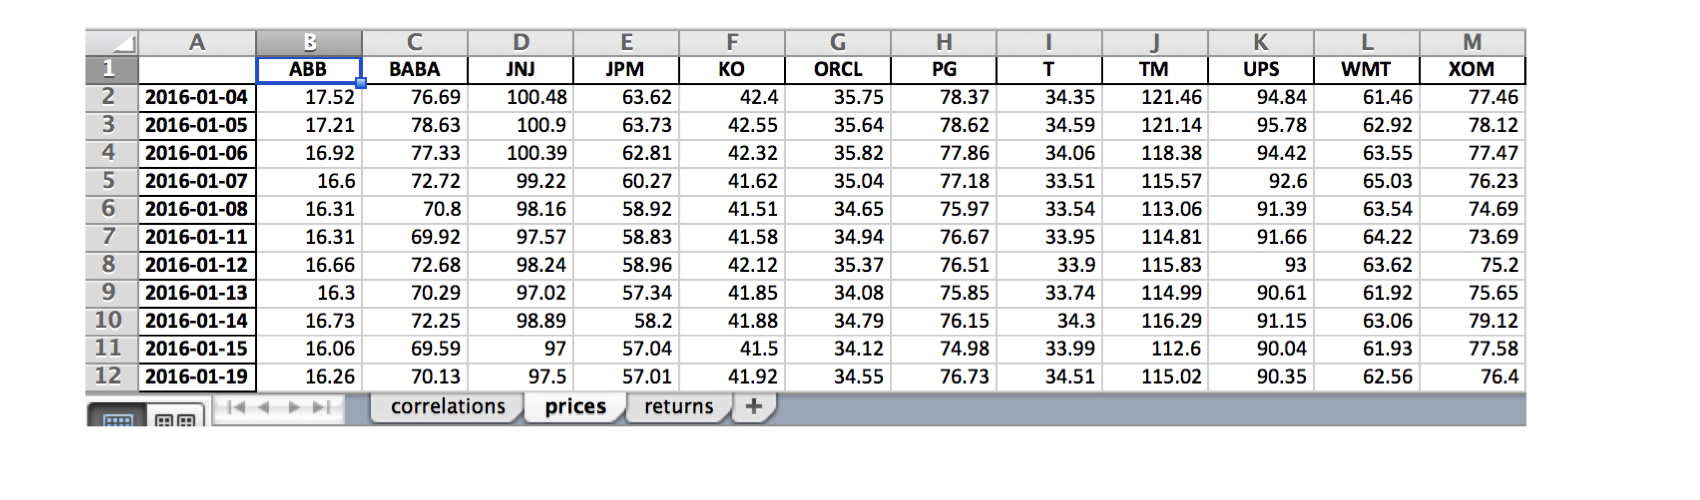
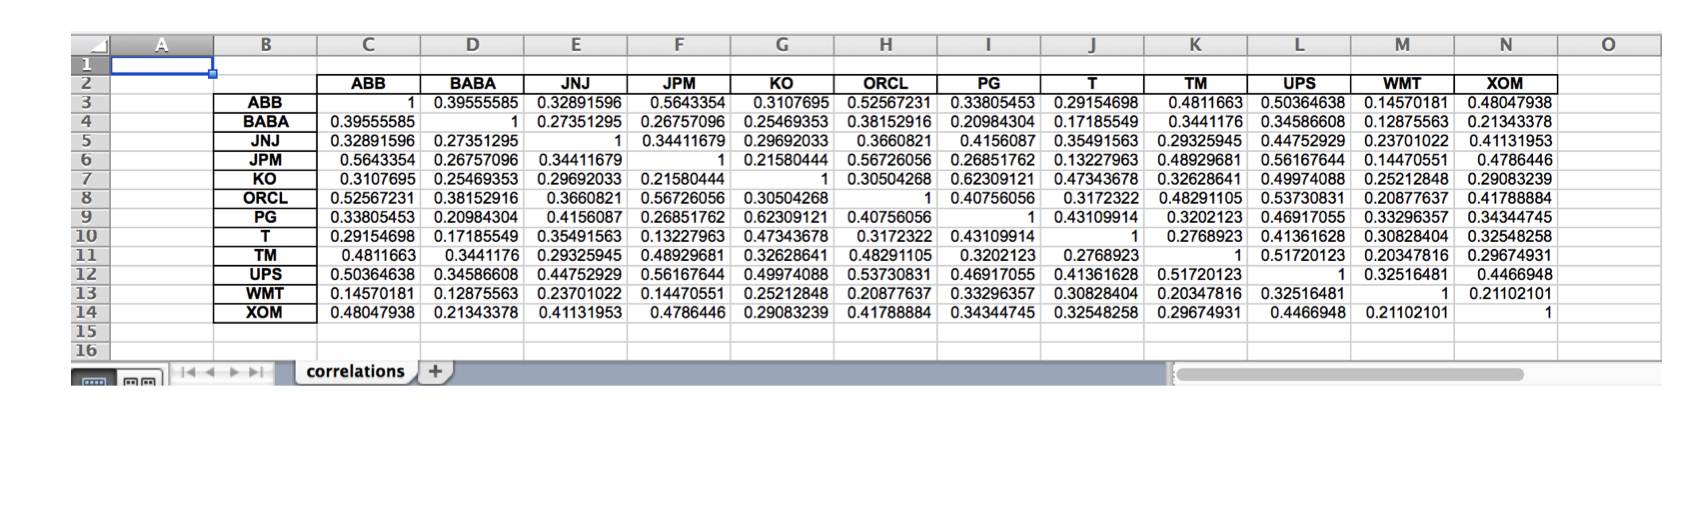
correlations.to_excel(excel_writer= 'correlations.xls',
sheet_name='correlations',
startrow=1,
startcol=1)

data.index = data.index.date # Keep only date componentwith pd.ExcelWriter('stock_data.xlsx') as writer:corr.to_excel(excel_writer=writer, sheet_name='correlations')data.to_excel(excel_writer=writer, sheet_name='prices')data.pct_change().to_excel(writer, sheet_name='returns')

Manipulación de series temporales en Python