Hacer predicciones
Introducción a la regresión con statsmodels en Python

Maarten Van den Broeck
Content Developer at DataCamp
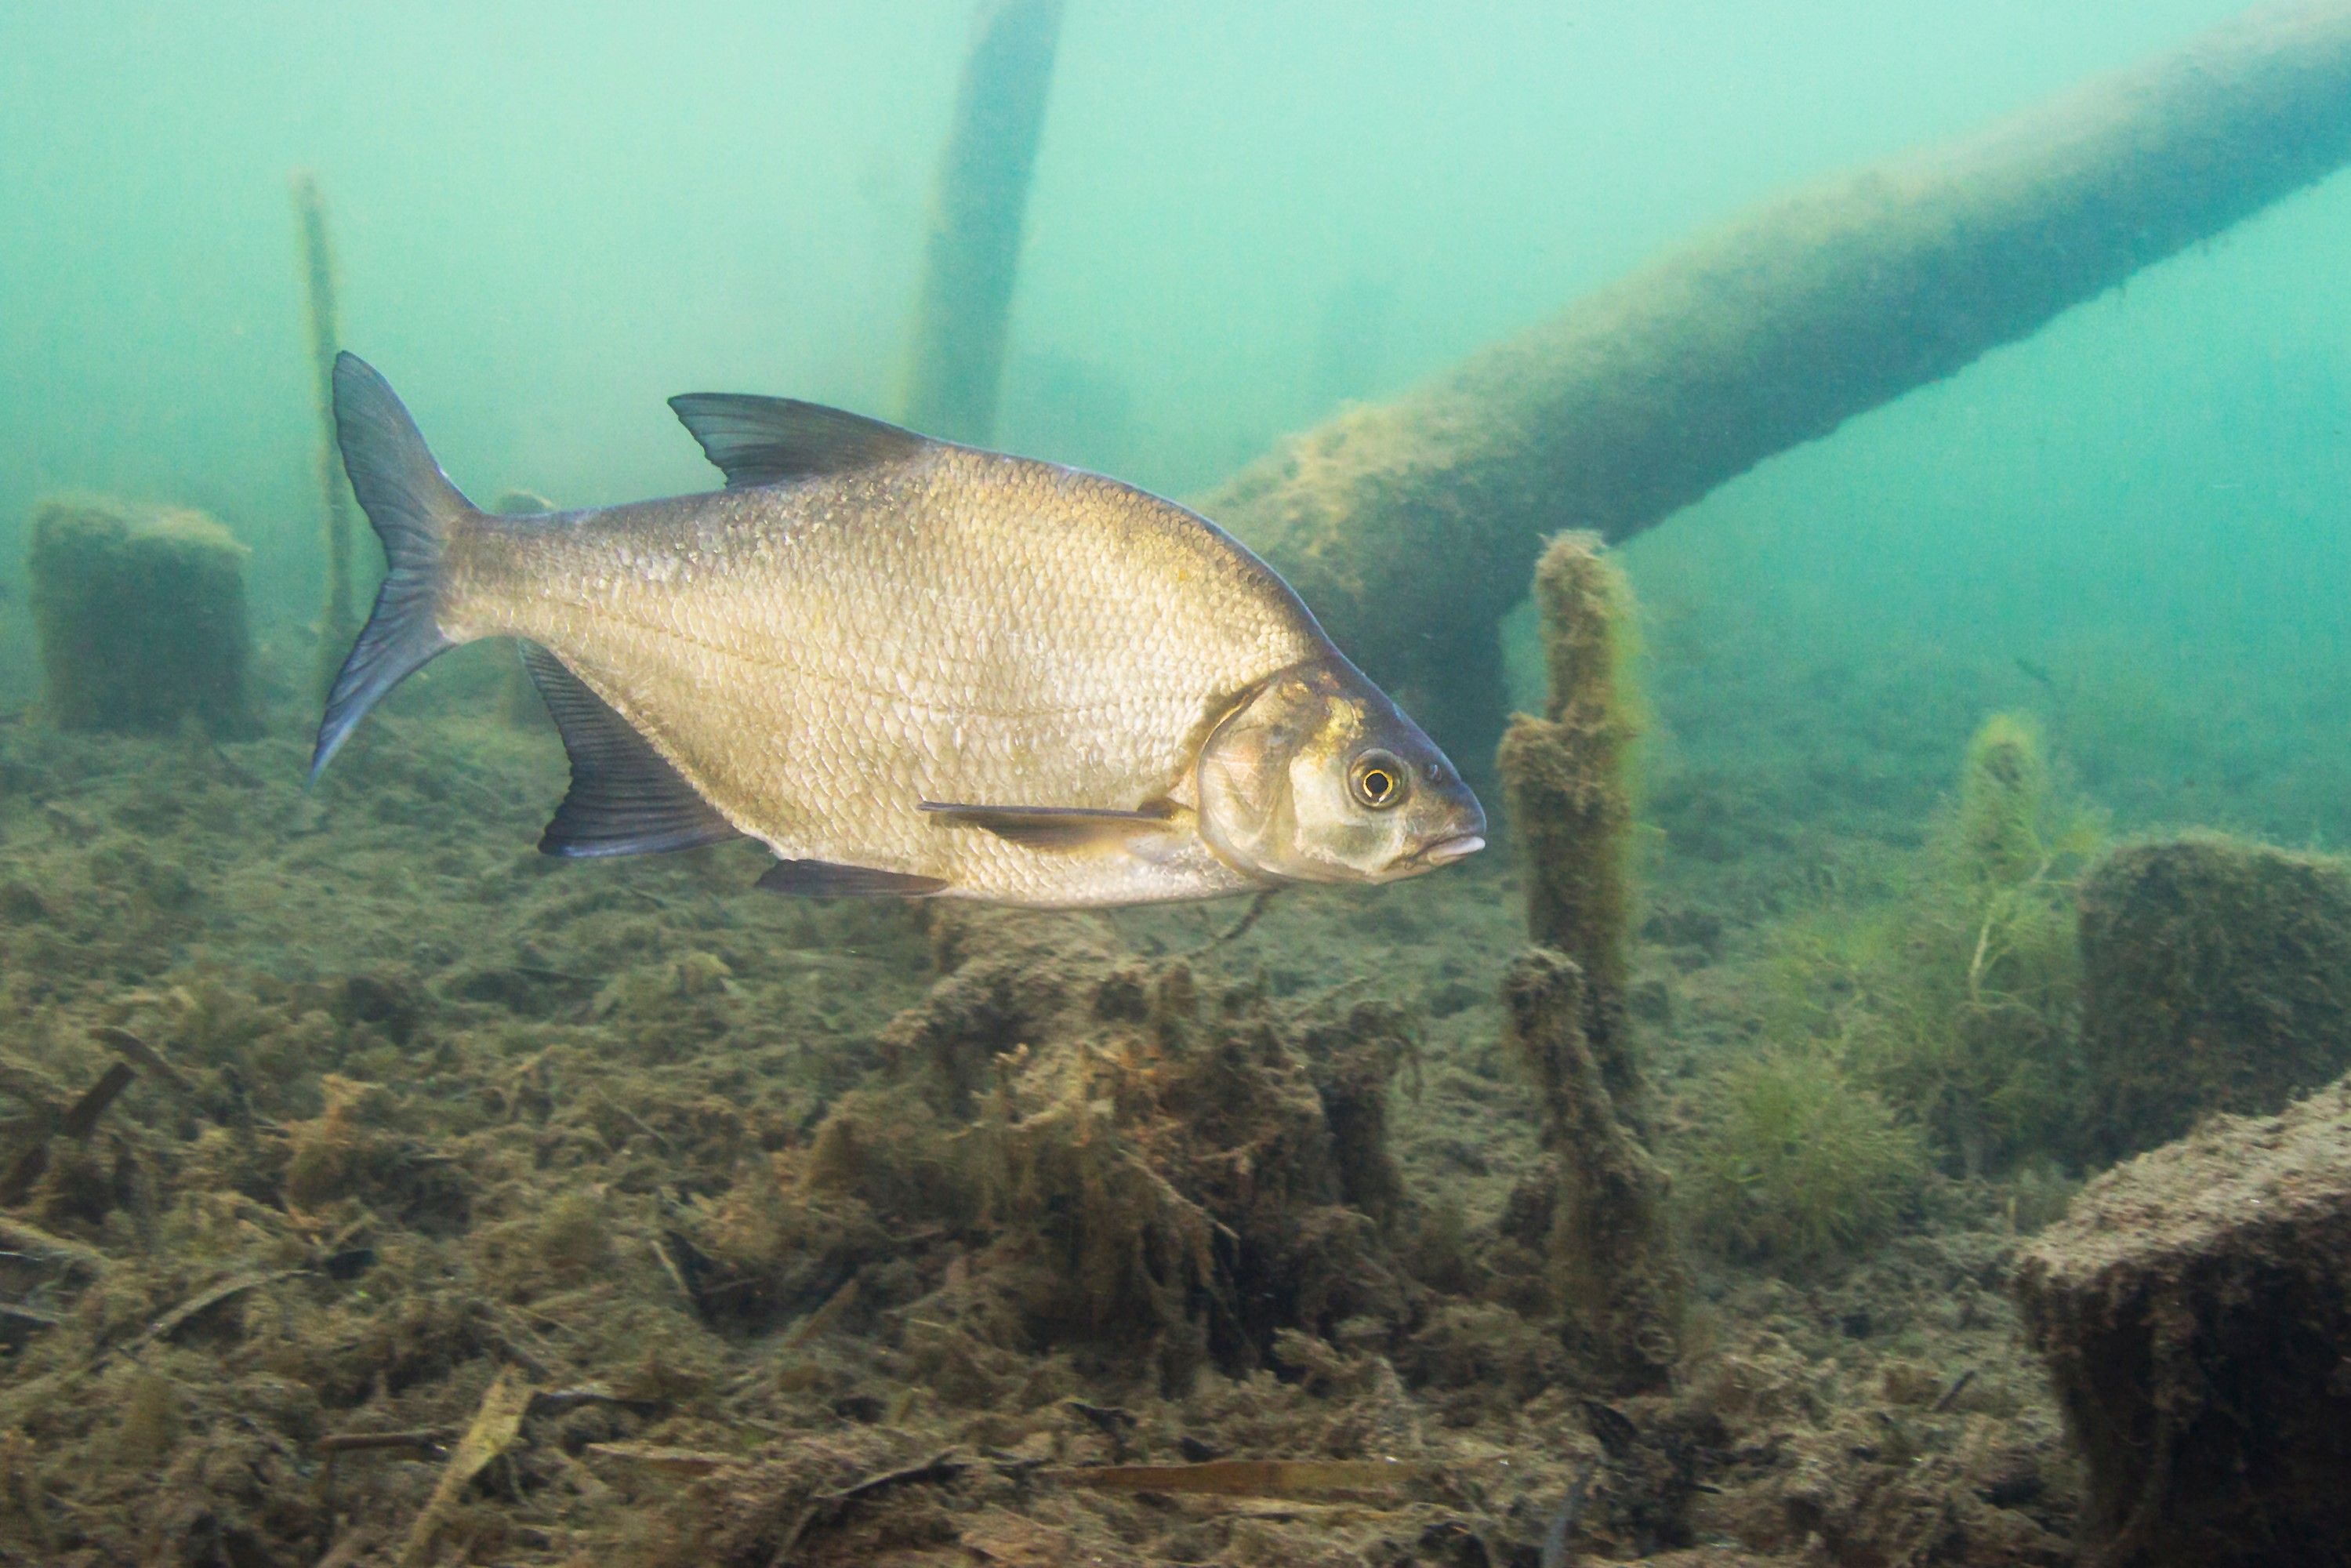
El dataset de peces: brema
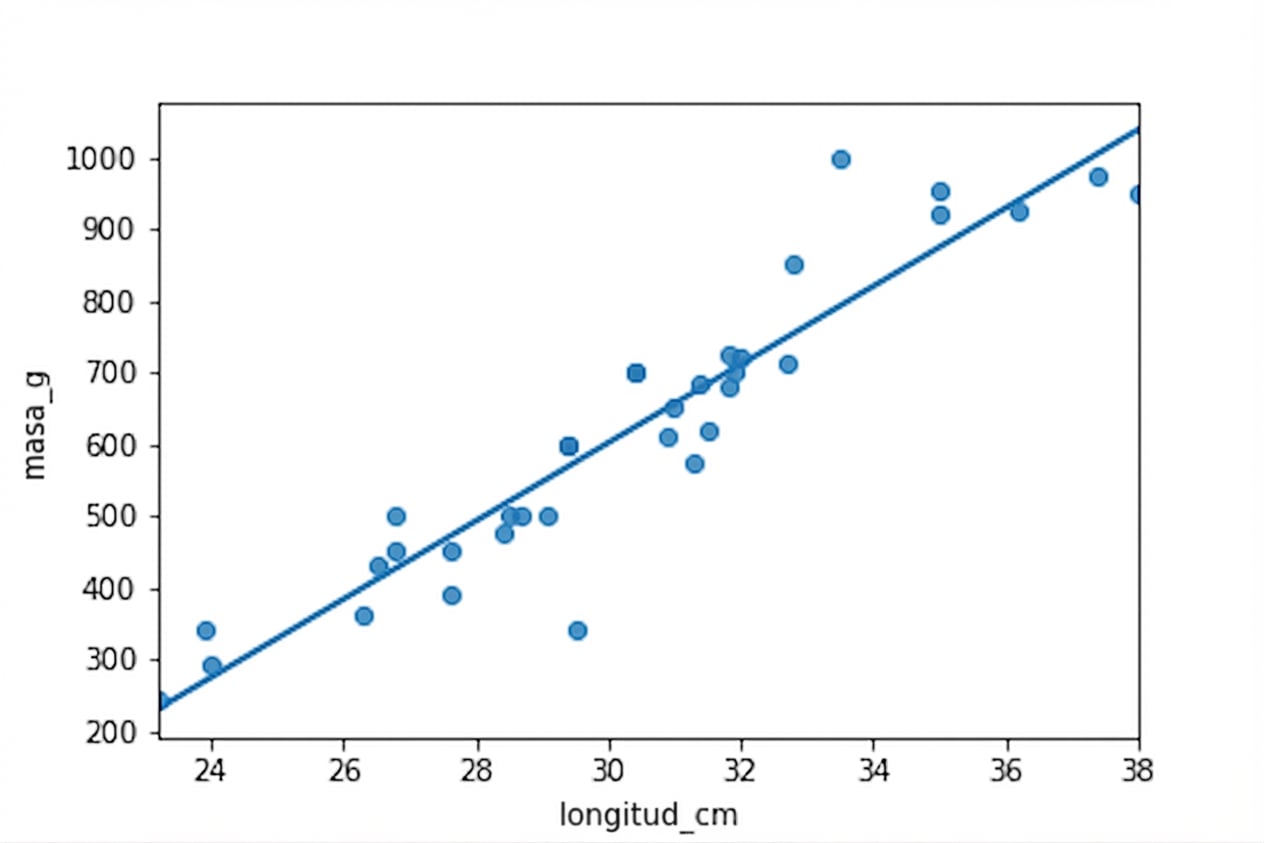
Graficar masa vs. longitud
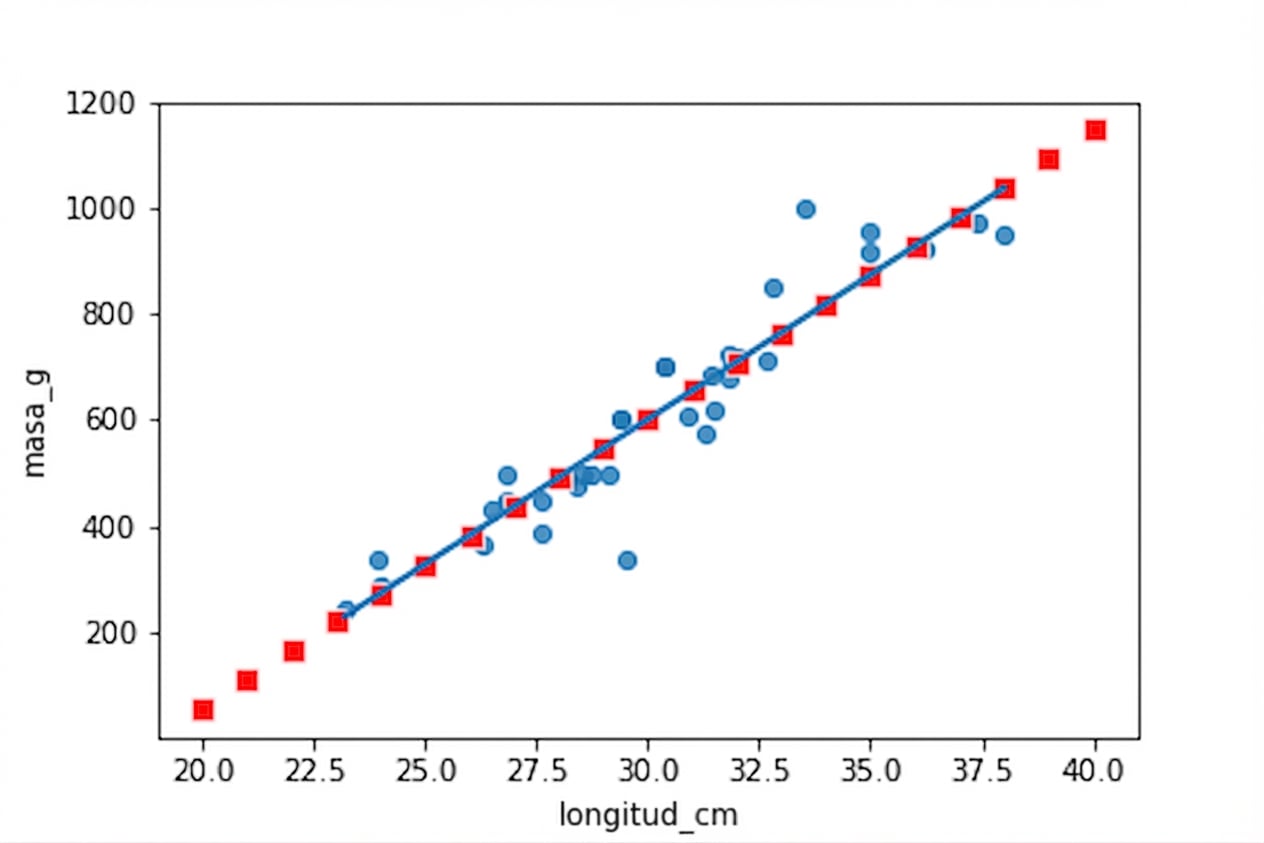
Mostrar predicciones
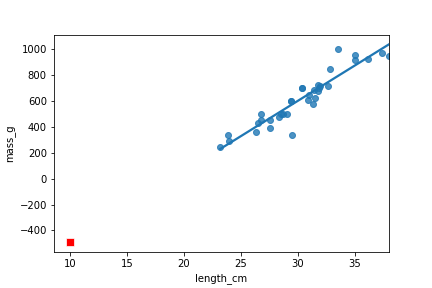
Extrapolar
Introducción a la regresión con statsmodels en Python
Maarten Van den Broeck
Content Developer at DataCamp

