Valores atípicos, apalancamiento e influencia
Introducción a la regresión con statsmodels en Python

Maarten Van den Broeck
Content Developer at DataCamp
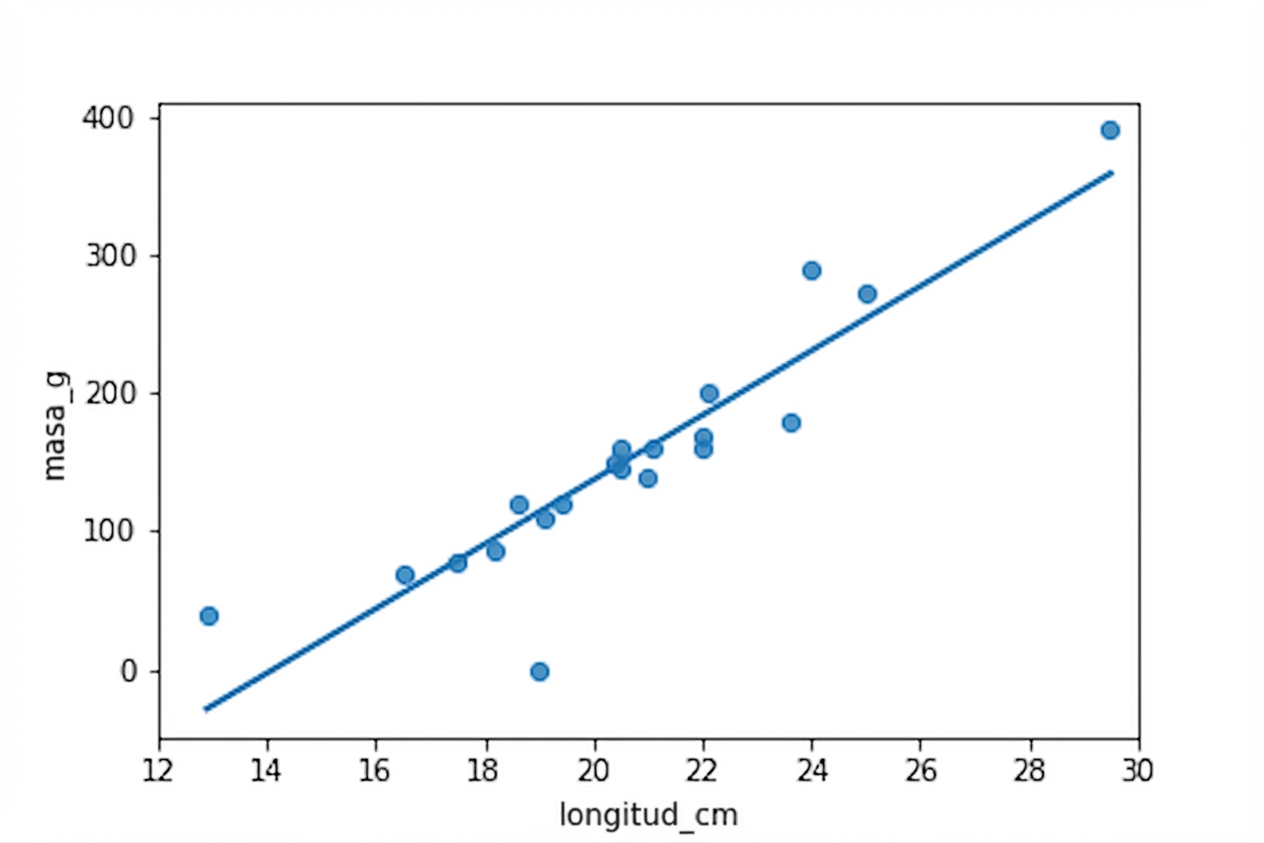
Datos de cucarillas

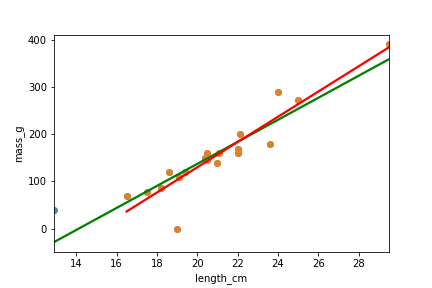
¿Qué puntos son atípicos?
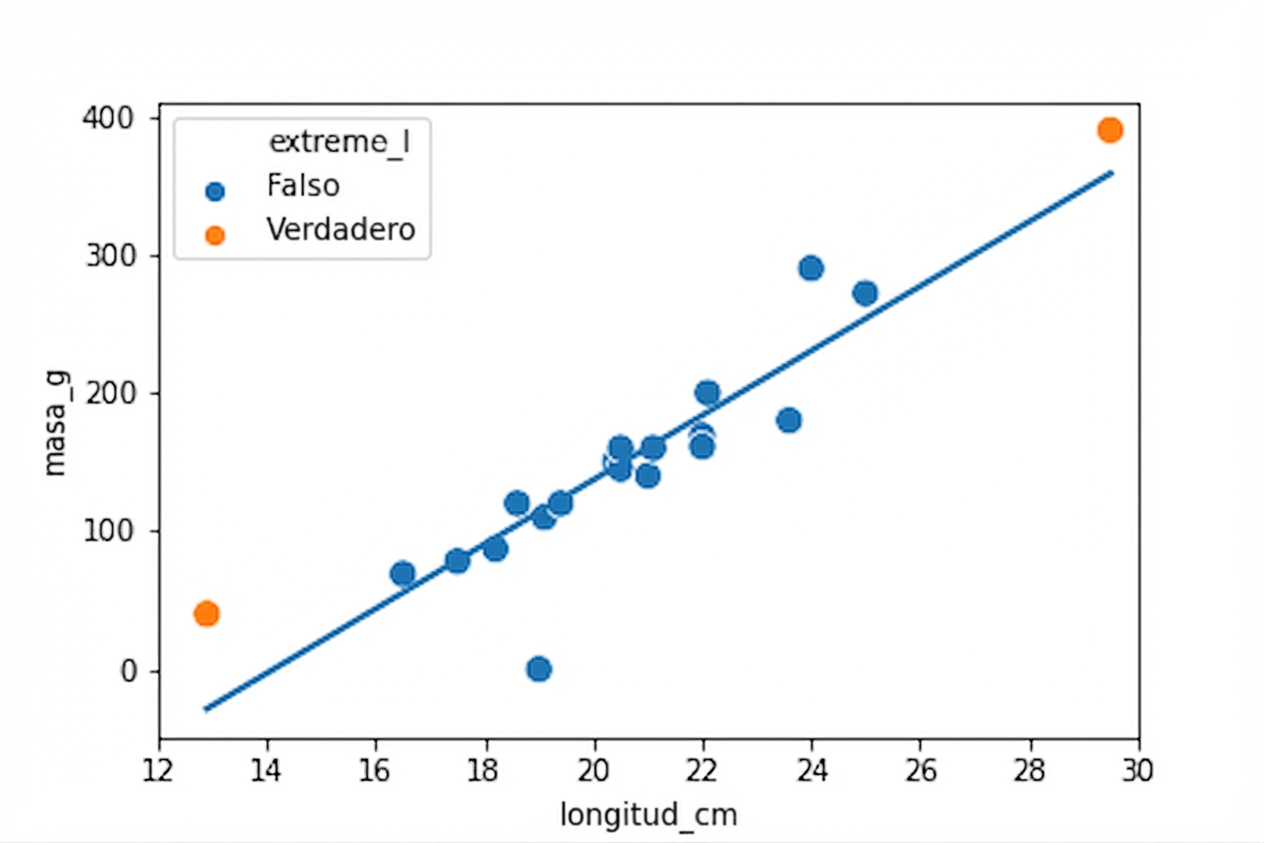
Valores explicativos extremos
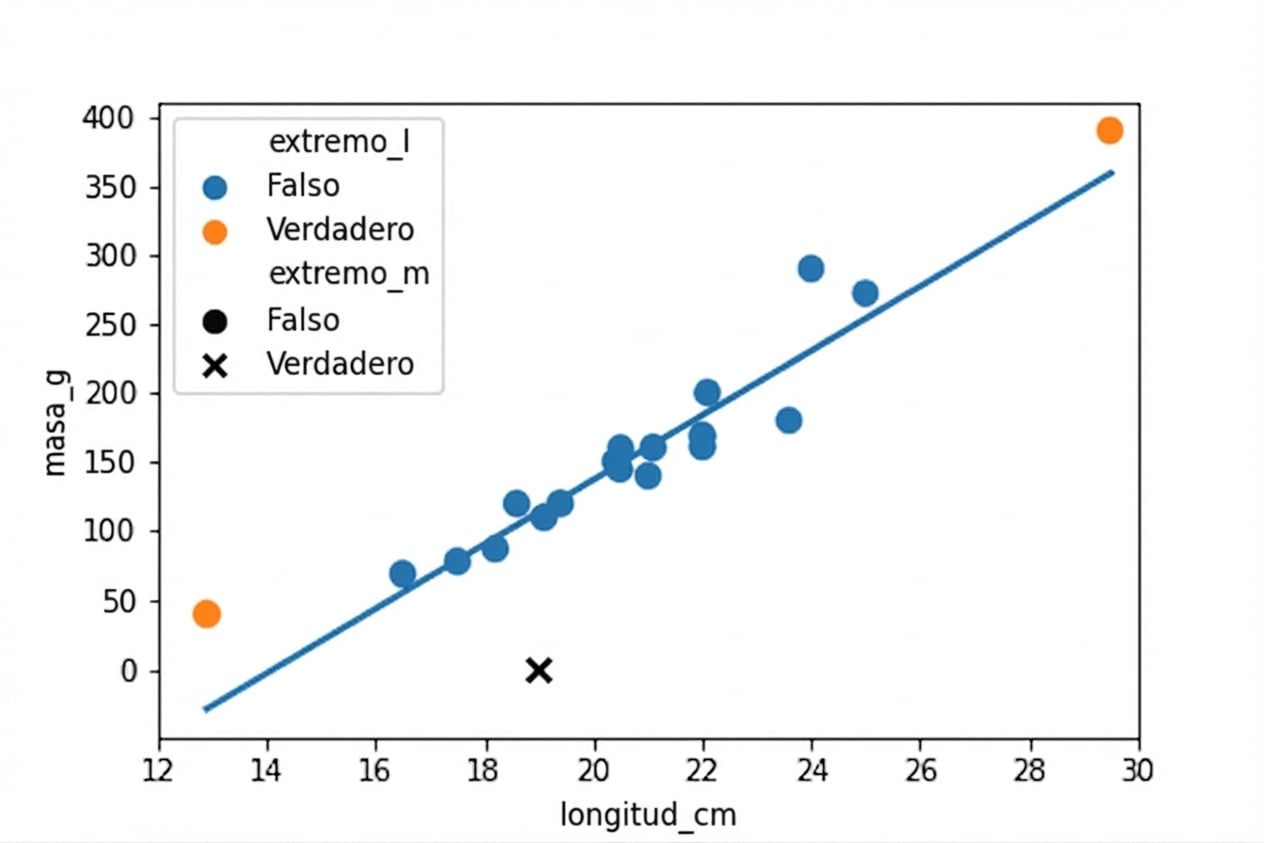
Valores de respuesta alejados de la recta de regresión
Apalancamiento e influencia
El apalancamiento mide lo extremas que son las variables explicativas.
La influencia mide cuánto cambia el modelo si dejas fuera la observación al ajustar.

Quitando la cucarilla más influyente