Introduction to Regression with statsmodels in Python
Maarten Van den Broeck
Content Developer at DataCamp
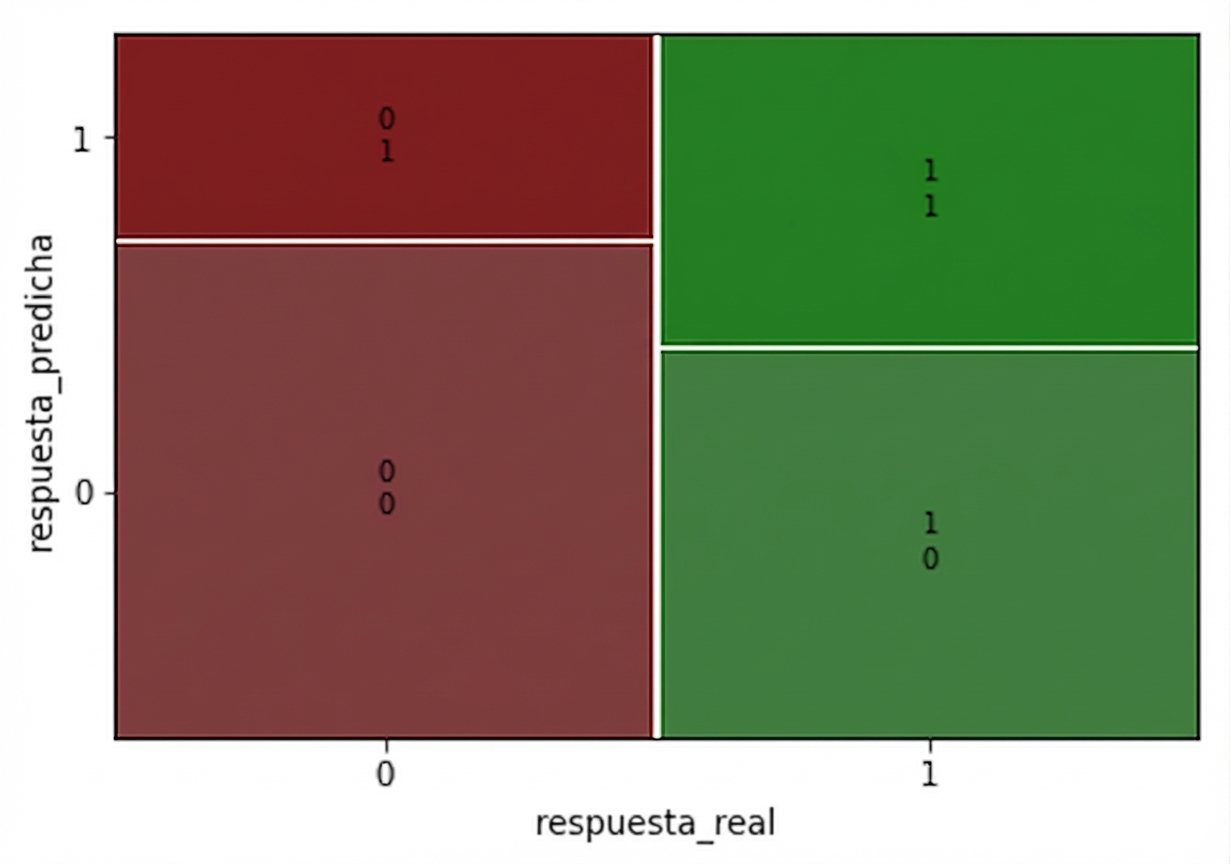
predicted false | predicted true | |
---|---|---|
actual false | correct | false positive |
actual true | false negative | correct |
actual_response = churn["has_churned"]
predicted_response = np.round(mdl_recency.predict())
outcomes = pd.DataFrame({"actual_response": actual_response,
"predicted_response": predicted_response})
print(outcomes.value_counts(sort=False))
actual_response predicted_response
0 0.0 141
1.0 59
1 0.0 111
1.0 89
conf_matrix = mdl_recency.pred_table()
print(conf_matrix)
[[141. 59.]
[111. 89.]]
true negative | false positive |
---|---|
false negative | true positive |
from statsmodels.graphics.mosaicplot
import mosaic
mosaic(conf_matrix)
Accuracy is the proportion of correct predictions.
$$ \text{accuracy} = \frac{TN + TP}{TN + FN + FP + TP} $$
[[141., 59.],
[111., 89.]]
TN = conf_matrix[0,0]
TP = conf_matrix[1,1]
FN = conf_matrix[1,0]
FP = conf_matrix[0,1]
acc = (TN + TP) / (TN + TP + FN + FP)
print(acc)
0.575
Sensitivity is the proportion of true positives.
$$ \text{sensitivity} = \frac{TP}{FN + TP} $$
[[141., 59.],
[111., 89.]]
TN = conf_matrix[0,0]
TP = conf_matrix[1,1]
FN = conf_matrix[1,0]
FP = conf_matrix[0,1]
sens = TP / (FN + TP)
print(sens)
0.445
Specificity is the proportion of true negatives.
$$ \text{specificity} = \frac{TN}{TN + FP} $$
[[141., 59.],
[111., 89.]]
TN = conf_matrix[0,0]
TP = conf_matrix[1,1]
FN = conf_matrix[1,0]
FP = conf_matrix[0,1]
spec = TN / (TN + FP)
print(spec)
0.705
Introduction to Regression with statsmodels in Python