Personaliza un informe con Q&A
Informes en Power BI

Maarten Van den Broeck
Content Developer at DataCamp
Cómo funciona
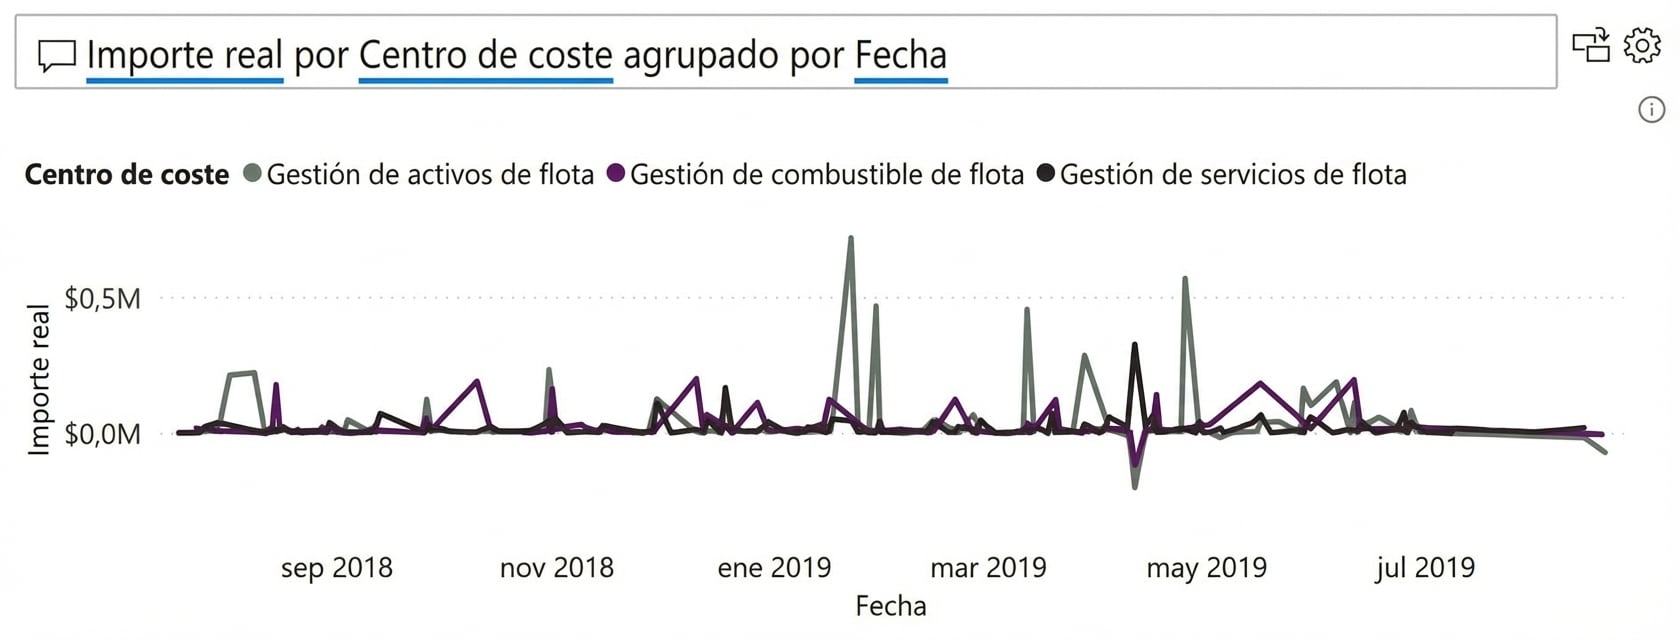
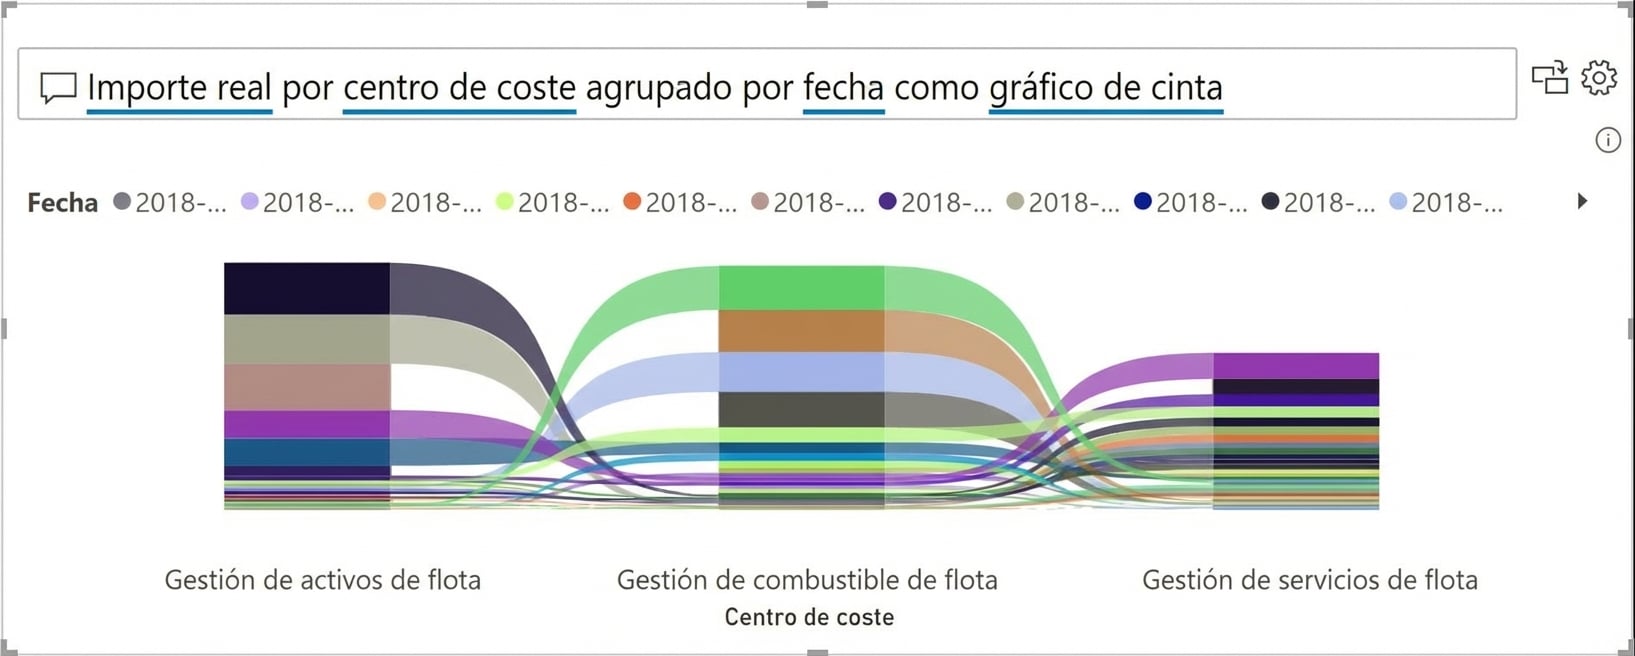
Pedir un visual específico
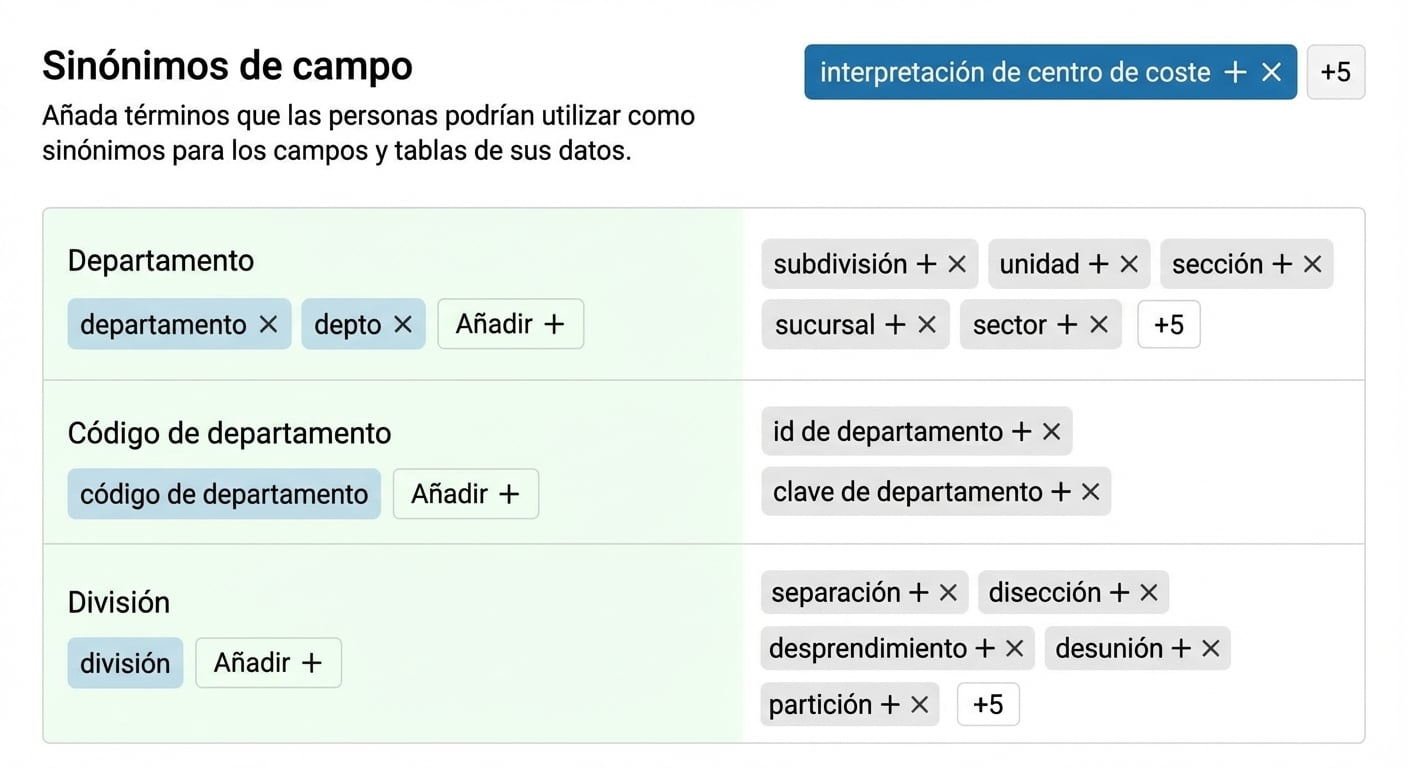
Sinónimos
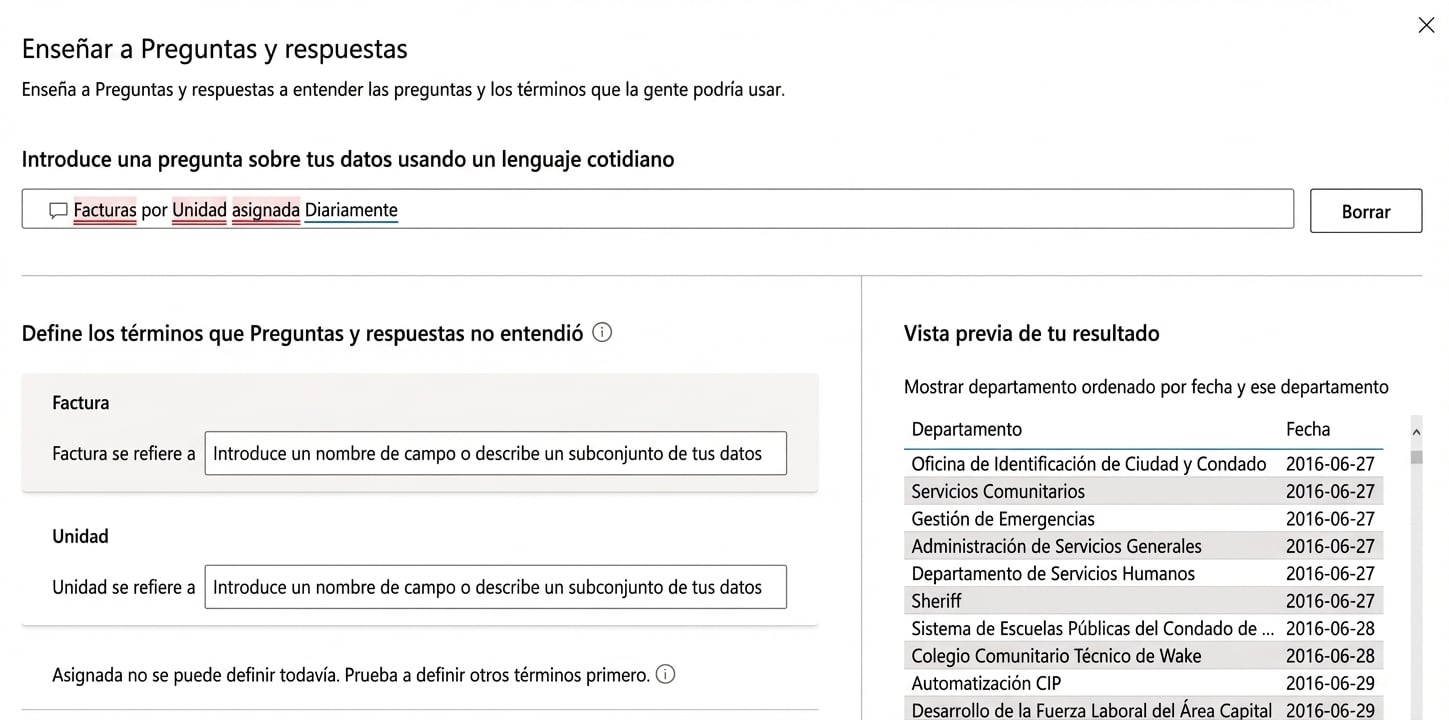
Gestiona términos con Enseñar a Q&A
Informes en Power BI
Maarten Van den Broeck
Content Developer at DataCamp

