Models for each category
Intermediate Regression in R

Richie Cotton
Data Evangelist at DataCamp
4 categories
unique(fish$species)
"Bream" "Roach" "Perch" "Pike"
Splitting the dataset
The smart way
- base-R:
split()+lapply() dplyr:nest_by()+mutate()
The simple way
bream <- fish %>%
  filter(species == "Bream")
perch <- fish %>%
  filter(species == "Perch")
pike <- fish %>%
  filter(species == "Pike")
roach <- fish %>%
  filter(species == "Roach")
4 models
mdl_bream <- lm(mass_g ~ length_cm, data = bream)
Call:
lm(formula = mass_g ~ length_cm, data = bream)

Coefficients:
(Intercept)    length_cm
   -1035.35        54.55
mdl_pike <- lm(mass_g ~ length_cm, data = pike)
Call:
lm(formula = mass_g ~ length_cm, data = pike)

Coefficients:
(Intercept)    length_cm
   -1540.82        53.19
mdl_perch <- lm(mass_g ~ length_cm, data = perch)
Call:
lm(formula = mass_g ~ length_cm, data = perch)

Coefficients:
(Intercept)    length_cm
    -619.18        38.91
mdl_roach <- lm(mass_g ~ length_cm, data = roach)
Call:
lm(formula = mass_g ~ length_cm, data = roach)

Coefficients:
(Intercept)    length_cm
    -329.38        23.32
Explanatory data
explanatory_data <- tibble(
  length_cm = seq(5, 60, 5)
)
Making predictions
prediction_data_bream <- explanatory_data %>%
  mutate(
    mass_g = predict(mdl_bream, explanatory_data),
    species = "Bream"
  )
prediction_data_pike <- explanatory_data %>%
  mutate(
    mass_g = predict(mdl_perch, explanatory_data),
    species = "Perch"
  )
prediction_data_perch <- explanatory_data %>%
  mutate(
    mass_g = predict(mdl_pike, explanatory_data),
    species = "Pike"
  )
prediction_data_roach <- explanatory_data %>%
  mutate(
    mass_g = predict(mdl_roach, explanatory_data),
    species = "Roach"
  )
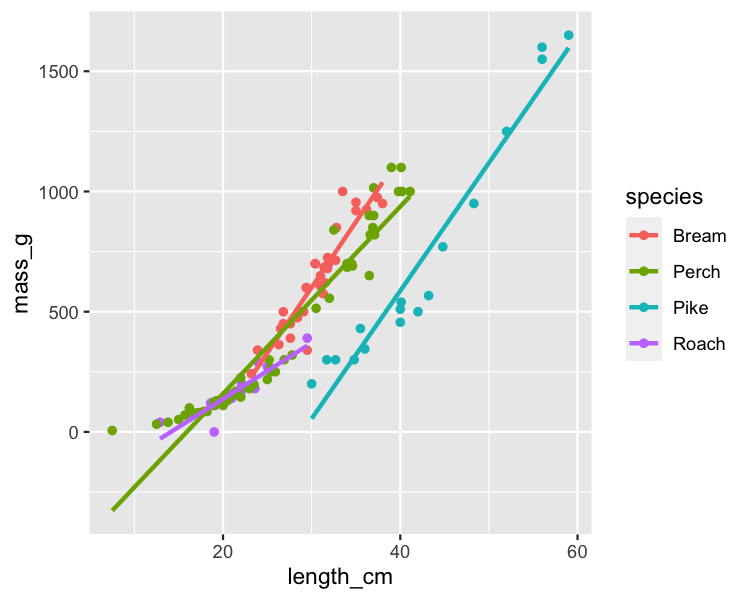
Visualizing predictions
ggplot(fish, aes(length_cm, mass_g, color = species)) +
  geom_point() +
  geom_smooth(method = "lm", se = FALSE)
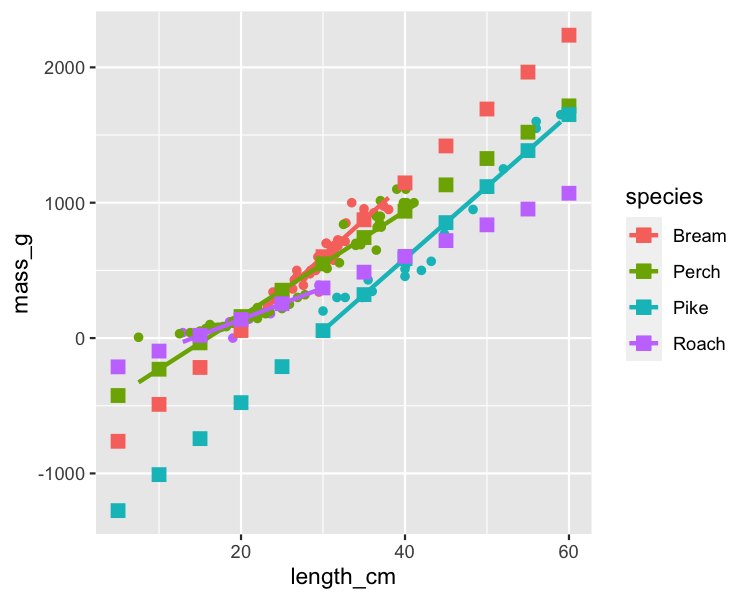
Adding in your predictions
ggplot(fish,aes(length_cm, mass_g, color = species)) +
  geom_point() +
  geom_smooth(method = "lm", se = FALSE) +
  geom_point(data = prediction_data_bream, size = 3, shape = 15) +
  geom_point(data = prediction_data_perch, size = 3, shape = 15) +
  geom_point(data = prediction_data_pike, size = 3, shape = 15) +
  geom_point(data = prediction_data_roach, size = 3, shape = 15)
Coefficient of determination
mdl_fish <- lm(mass_g ~ length_cm + species, data = fish)

mdl_fish %>%
  glance() %>%
  pull(adj.r.squared)
0.917
mdl_bream %>% glance() %>% pull(adj.r.squared)
0.874
mdl_perch %>% glance() %>% pull(adj.r.squared)
0.917
mdl_pike %>% glance() %>% pull(adj.r.squared)
0.941
mdl_roach %>% glance() %>% pull(adj.r.squared)
0.815
Residual standard error
mdl_fish %>%
  glance() %>%
  pull(sigma)
103
mdl_bream %>% glance() %>% pull(sigma)
74.2
mdl_perch %>% glance() %>% pull(sigma)
100
mdl_pike %>% glance() %>% pull(sigma)
120
mdl_roach %>% glance() %>% pull(sigma)
38.2
Let's practice!
Intermediate Regression in R

