Two numeric explanatory variables
Intermediate Regression in R

Richie Cotton
Data Evangelist at DataCamp
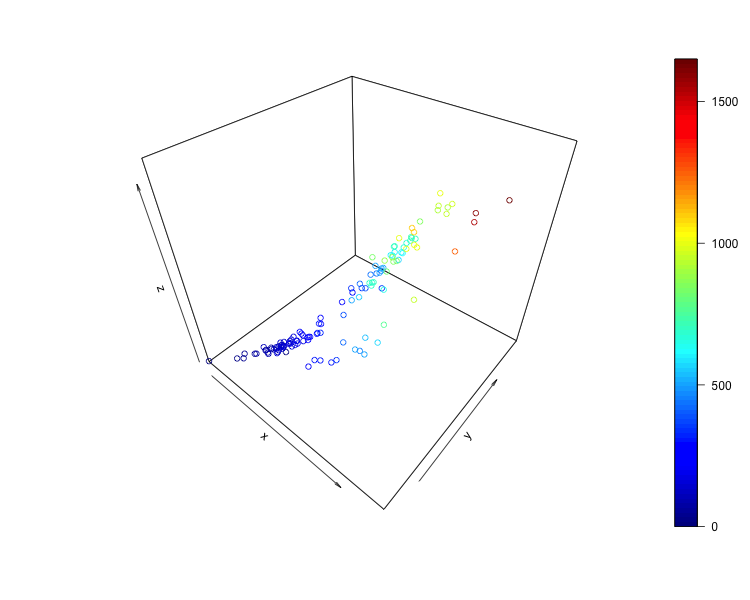
3D scatter plot
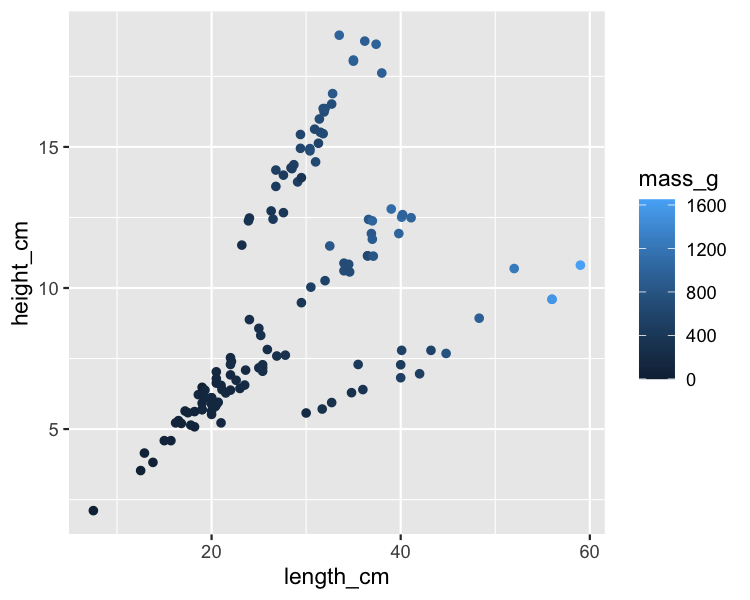
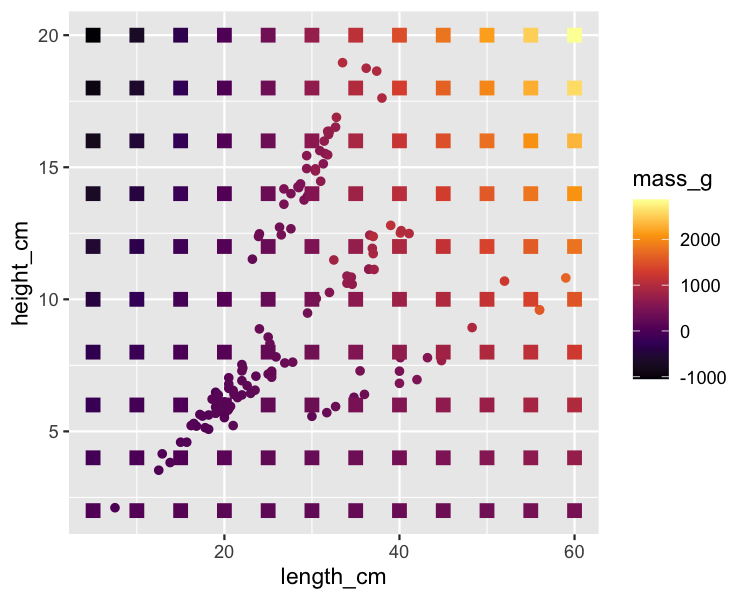
2D scatter plot, color for response
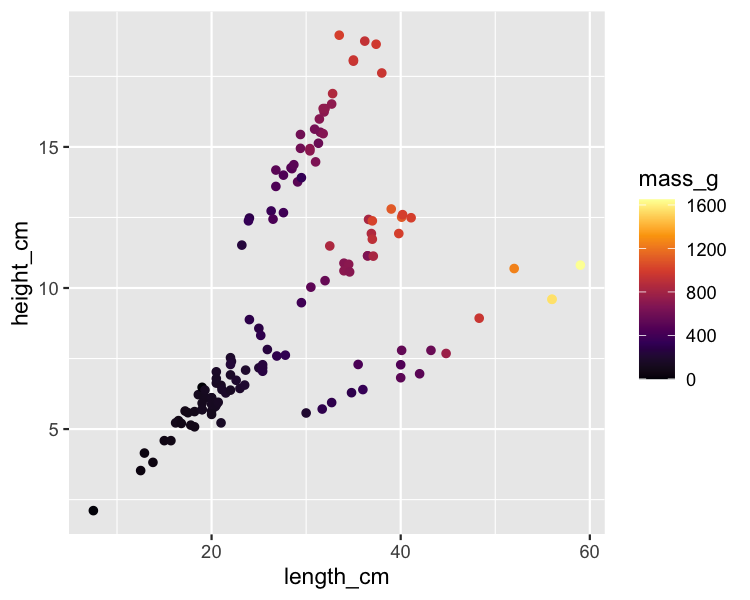
Viridis color scales
Plotting the predictions
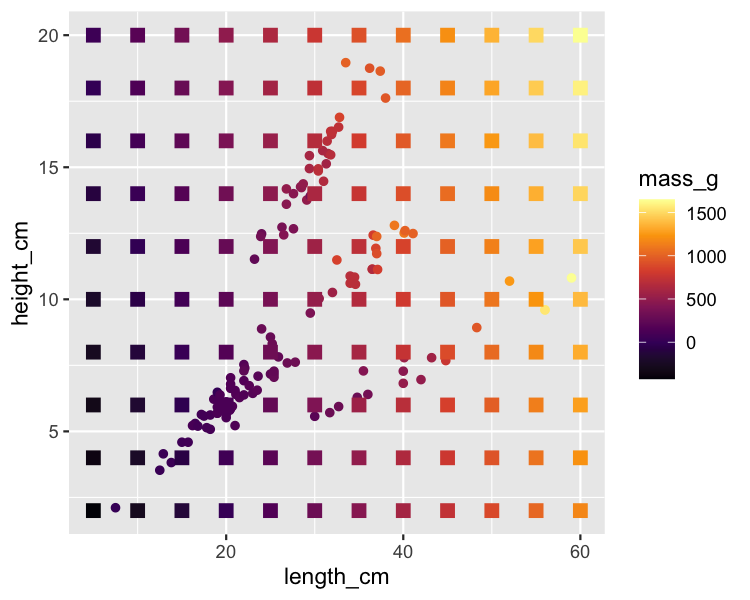
Plotting the predictions
Intermediate Regression in R
Richie Cotton
Data Evangelist at DataCamp

