Transformaciones avanzadas de datos con pandas
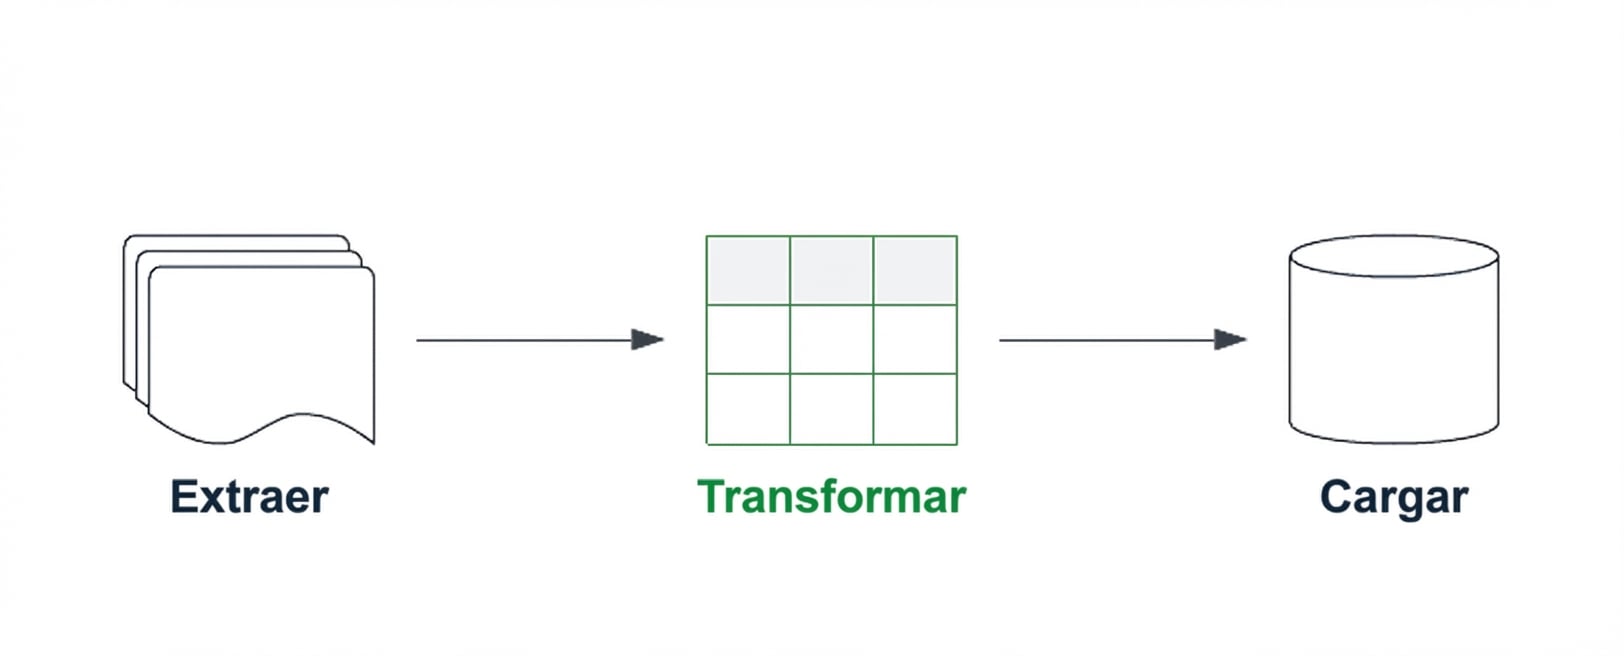
ETL y ELT en Python

Jake Roach
Data Engineer
Transformaciones avanzadas de datos con pandas
Rellenar valores faltantes con pandas
timestamps           volume      open     close
1997-05-15 13:30:00  1443120000  0.121875  0.097917
1997-05-16 13:30:00   294000000  NaN       0.086458
1997-05-19 13:30:00   122136000  0.088021  NaN
# Fill all NaN with value 0
clean_stock_data = raw_stock_data.fillna(value=0)
timestamps           volume      open     close
1997-05-15 13:30:00  1443120000  0.121875  0.097917
1997-05-16 13:30:00   294000000  0.000000  0.086458
1997-05-19 13:30:00   122136000  0.088021  0.000000
Rellenar valores faltantes con pandas
timestamps           volume      open     close
1997-05-15 13:30:00  1443120000  0.121875  0.097917
1997-05-16 13:30:00   294000000  NaN       0.086458
1997-05-19 13:30:00   122136000  0.088021  NaN
# Fill NaN values with specific value for each column
clean_stock_data = raw_stock_data.fillna(value={"open": 0, "close": .5}, axis=1)
timestamps           volume      open     close
1997-05-15 13:30:00  1443120000  0.121875  0.097917
1997-05-16 13:30:00   294000000  0.000000  0.086458
1997-05-19 13:30:00   122136000  0.088021  0.500000
Rellenar valores faltantes con pandas
timestamps           volume      open     close
1997-05-15 13:30:00  1443120000  0.121875  0.097917
1997-05-16 13:30:00   294000000  NaN       0.086458
1997-05-19 13:30:00   122136000  0.088021  NaN
# Fill NaN value using other columns
raw_stock_data["open"].fillna(raw_stock_data["close"], inplace=True)
timestamps           volume      open     close
1997-05-15 13:30:00  1443120000  0.121875  0.097917
1997-05-16 13:30:00   294000000  0.086458  0.086458
1997-05-19 13:30:00   122136000  0.088021  NaN
Agrupar datos
SELECT
    ticker,
    AVG(volume),
    AVG(open),
    AVG(close)
FROM raw_stock_data
GROUP BY ticker;
El método .groupby() puede recrear la consulta anterior con pandas
Agrupar datos con pandas
ticker  volume        open        close
AAPL    1443120000    0.121875    0.097917
AAPL     297000000    0.098146    0.086458
AMZN     124186000    0.247511    0.251290
# Use Python to group data by ticker, find the mean of the reamining columns
grouped_stock_data = raw_stock_data.groupby(by=["ticker"], axis=0).mean()
          volume        open        close
ticker
AAPL      1.149287e+08    34.998377  34.986851
AMZN      1.434213e+08    30.844692  30.830233
Puedes usar .min(), .max() y .sum() para agregar datos
Aplicar transformaciones avanzadas a DataFrames
El método .apply() permite transformaciones más avanzadas
def classify_change(row):
    change = row["close"] - row["open"]
    if change > 0:
        return "Increase"
    else:
        return "Decrease"
# Apply transformation to DataFrame
raw_stock_data["change"] = raw_stock_data.apply(
    classify_change,
    axis=1
)
Antes de la transformación
ticker  ...  open        close
AAPL         0.121875    0.097917
AAPL         0.098146    0.086458
AMZN         0.247511    0.251290
$$
Después de la transformación
ticker  ...  open        close       change
AAPL         0.121875    0.097917    Decrease
AAPL         0.098146    0.086458    Decrease
AMZN         0.247511    0.251290    Increase
¡Vamos a practicar!
ETL y ELT en Python

