Gepaarte t-Tests
Hypothesentests in Python

James Chapman
Curriculum Manager, DataCamp
Datensatz: US-Republikaner bei Präsidentschaftswahlen
         state       county  repub_percent_08  repub_percent_12
0      Alabama         Hale         38.957877         37.139882
1     Arkansas       Nevada         56.726272         58.983452
2   California         Lake         38.896719         39.331367
3   California      Ventura         42.923190         45.250693
..         ...          ...               ...               ...
96   Wisconsin    La Crosse         37.490904         40.577038
97   Wisconsin    Lafayette         38.104967         41.675050
98     Wyoming       Weston         76.684241         83.983328
99      Alaska  District 34         77.063259         40.789626

[100 rows x 4 columns]
100 Zeilen; jede Zeile entspricht Stimmen auf Landkreis-Ebene in einer Präsidentschaftswahl.
Hypothesen
Frage: War der Stimmenanteil des republikanischen Kandidaten 2008 niedriger als 2012?
$H_{0}$: $\mu_{2008} - \mu_{2012} = 0$
$H_{A}$: $\mu_{2008} - \mu_{2012} < 0$
Setze das Signifikanzniveau $\alpha = 0{,}05$.
- Daten sind gepaart → jeder Stimmenanteil bezieht sich auf denselben Landkreis
- Abbildung von Wahlmustern im Modell gewünscht
Von zwei Stichproben zu einer
sample_data = repub_votes_potus_08_12
sample_data['diff'] = sample_data['repub_percent_08'] - sample_data['repub_percent_12']
import matplotlib.pyplot as plt
sample_data['diff'].hist(bins=20)
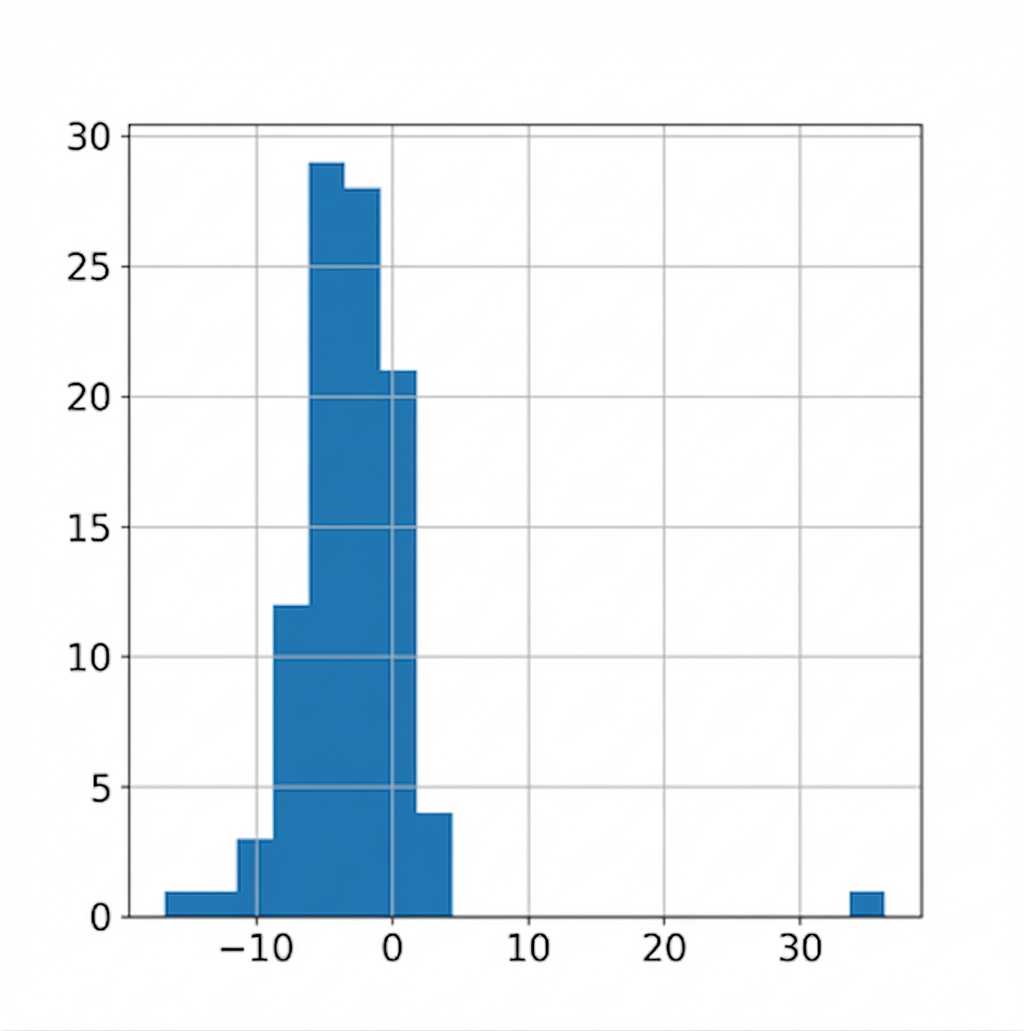
Stichprobenstatistik der Differenz berechnen
xbar_diff = sample_data['diff'].mean()
-2.877109041242944
Überarbeitete Hypothesen
Alte Hypothesen:
$H_{0}$: $\mu_{2008} - \mu_{2012} = 0$
$H_{A}$: $\mu_{2008} - \mu_{2012} < 0$
Neue Hypothesen:
$H_{0}$: $\mu_{\text{diff}} = 0$
$H_{A}$: $ \mu_{\text{diff}} < 0$
$t = \dfrac{\bar{x}_{\text{diff}} - \mu_{\text{diff}}}{\sqrt{\dfrac{s_{diff}^2}{n_{\text{diff}}}}}$
$df = n_{diff} - 1$
Berechnung des p-Werts
n_diff = len(sample_data)
100
s_diff = sample_data['diff'].std()
t_stat = (xbar_diff-0) / np.sqrt(s_diff**2/n_diff)
-5.601043121928489
degrees_of_freedom = n_diff - 1
99
$t = \dfrac{\bar{x}_{\text{diff}} - \mu_{\text{diff}}}{\sqrt{\dfrac{s_{\text{diff}}^2}{n_{\text{diff}}}}}$
$df = n_{\text{diff}} - 1$
from scipy.stats import t
p_value = t.cdf(t_stat, df=n_diff-1)
9.572537285272411e-08
Differenzen zweier Mittelwerte mit ttest() prüfen
import pingouinpingouin.ttest(x=sample_data['diff'],y=0,alternative="less")
               T  dof alternative         p-val          CI95%   cohen-d  \
T-test -5.601043   99        less  9.572537e-08  [-inf, -2.02]  0.560104

             BF10  power
T-test  1.323e+05    1.0
ttest() mit paired=True
pingouin.ttest(x=sample_data['repub_percent_08'],
               y=sample_data['repub_percent_12'],
               paired=True,
               alternative="less")
               T  dof alternative         p-val          CI95%   cohen-d  \
T-test -5.601043   99        less  9.572537e-08  [-inf, -2.02]  0.217364

             BF10     power
T-test  1.323e+05  0.696338
Ungepaarter ttest()
pingouin.ttest(x=sample_data['repub_percent_08'],
               y=sample_data['repub_percent_12'],
               paired=False, # The default
               alternative="less")
               T  dof alternative     p-val         CI95%   cohen-d   BF10  \
T-test -1.536997  198        less  0.062945  [-inf, 0.22]  0.217364  0.927

           power
T-test  0.454972
- Ungepaarte t-Tests auf gepaarten Daten erhöhen die Chance auf falsch-negative Fehler
Lass uns üben!
Hypothesentests in Python

