Chi-Quadrat-Unabhängigkeitstest
Hypothesentests in Python

James Chapman
Curriculum Manager, DataCamp
Proportionstest wiederholen
age_by_hobbyist = stack_overflow.groupby("age_cat")['hobbyist'].value_counts()
age_cat      hobbyist
At least 30  Yes          812
             No           238
Under 30     Yes         1021
             No           190
Name: hobbyist, dtype: int64
from statsmodels.stats.proportion import proportions_ztest
n_hobbyists = np.array([812, 1021])
n_rows = np.array([812 + 238, 1021 + 190])
stat, p_value = proportions_ztest(count=n_hobbyists, nobs=n_rows,
                                  alternative="two-sided")
(-4.223691463320559, 2.403330142685068e-05)
Unabhängigkeit von Variablen
Vorheriges Testergebnis: Hinweis, dass hobbyist und age_cat zusammenhängen
Statistische Unabhängigkeit – der Erfolgsanteil in der Antwortvariablen ist in allen Kategorien der erklärenden Variablen gleich
Test auf Unabhängigkeit von Variablen
import pingouin
expected, observed, stats = pingouin.chi2_independence(data=stack_overflow, x='hobbyist',
                                                       y='age_cat', correction=False)
print(stats)
                 test    lambda       chi2  dof      pval    cramer     power
0             pearson  1.000000  17.839570  1.0  0.000024  0.088826  0.988205
1        cressie-read  0.666667  17.818114  1.0  0.000024  0.088773  0.988126
2      log-likelihood  0.000000  17.802653  1.0  0.000025  0.088734  0.988069
3       freeman-tukey -0.500000  17.815060  1.0  0.000024  0.088765  0.988115
4  mod-log-likelihood -1.000000  17.848099  1.0  0.000024  0.088848  0.988236
5              neyman -2.000000  17.976656  1.0  0.000022  0.089167  0.988694
$\chi^2$-Statistik = 17.839570 = $(-4.223691463320559)^2$ = ($z$-Wert)$^2$
Arbeitszufriedenheit und Alterskategorie
stack_overflow['age_cat'].value_counts()
Under 30       1211
At least 30    1050
Name: age_cat, dtype: int64
stack_overflow['job_sat'].value_counts()
Very satisfied           879
Slightly satisfied       680
Slightly dissatisfied    342
Neither                  201
Very dissatisfied        159
Name: job_sat, dtype: int64
Hypothesen formulieren
$H_{0}$: Alterskategorien sind unabhängig von der Arbeitszufriedenheit
$H_{A}$: Alterskategorien sind nicht unabhängig von der Arbeitszufriedenheit
alpha = 0.1
- Teststatistik: $\chi^{2}$
- Unter Unabhängigkeit: Wie weit weichen Beobachtungen von den erwarteten Werten ab?
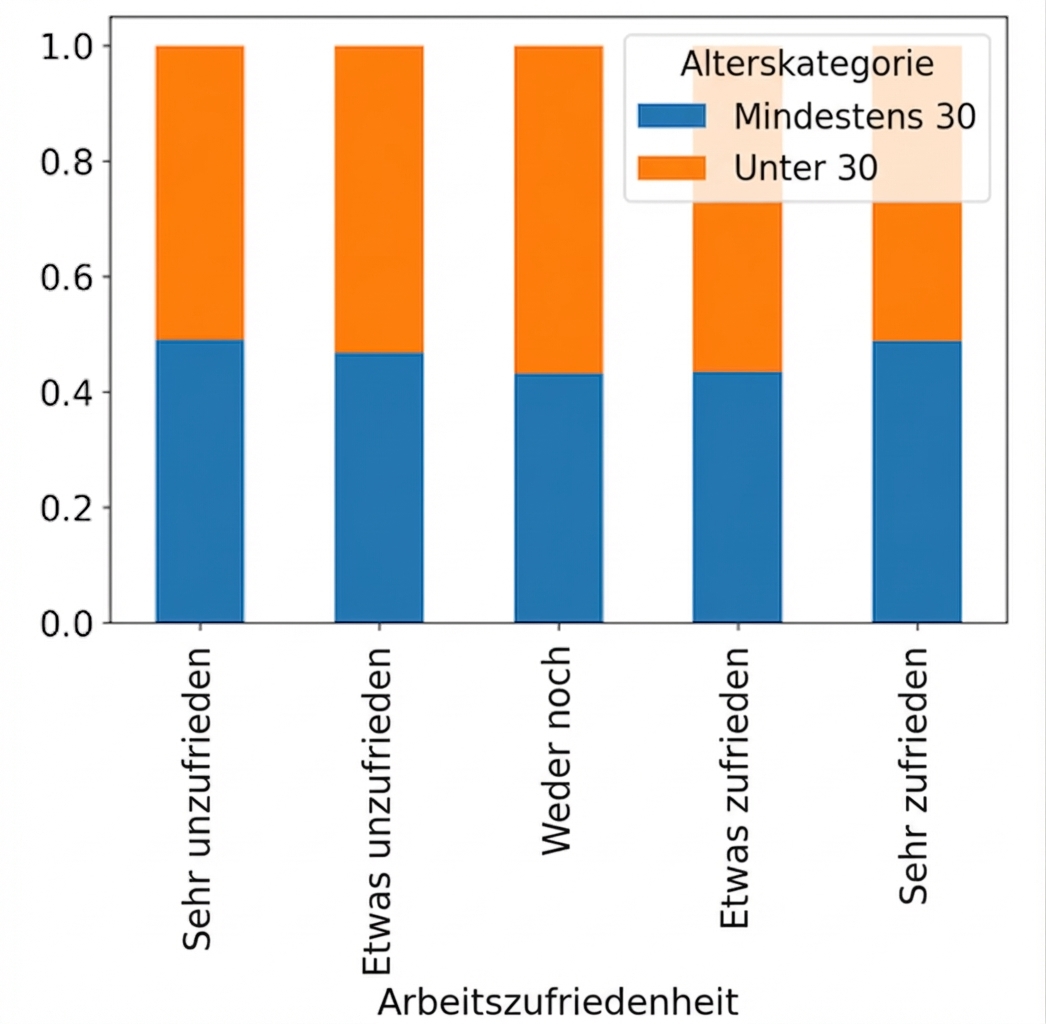
Explorative Visualisierung: proportionierter Stapelbalken
props = stack_overflow.groupby('job_sat')['age_cat'].value_counts(normalize=True)wide_props = props.unstack()wide_props.plot(kind="bar", stacked=True)
Explorative Visualisierung: proportionierter Stapelbalken
Chi-Quadrat-Unabhängigkeitstest
import pingouin
expected, observed, stats = pingouin.chi2_independence(data=stack_overflow, x="job_sat", y="age_cat")
print(stats)
                 test    lambda      chi2  dof      pval    cramer     power
0             pearson  1.000000  5.552373  4.0  0.235164  0.049555  0.437417
1        cressie-read  0.666667  5.554106  4.0  0.235014  0.049563  0.437545
2      log-likelihood  0.000000  5.558529  4.0  0.234632  0.049583  0.437871
3       freeman-tukey -0.500000  5.562688  4.0  0.234274  0.049601  0.438178
4  mod-log-likelihood -1.000000  5.567570  4.0  0.233854  0.049623  0.438538
5              neyman -2.000000  5.579519  4.0  0.232828  0.049676  0.439419
Freiheitsgrade:
$(\text{Anzahl Antwortkategorien} - 1) \times (\text{Anzahl Erklärungskategorien} - 1)$
$(2 - 1) * (5 - 1) = 4$
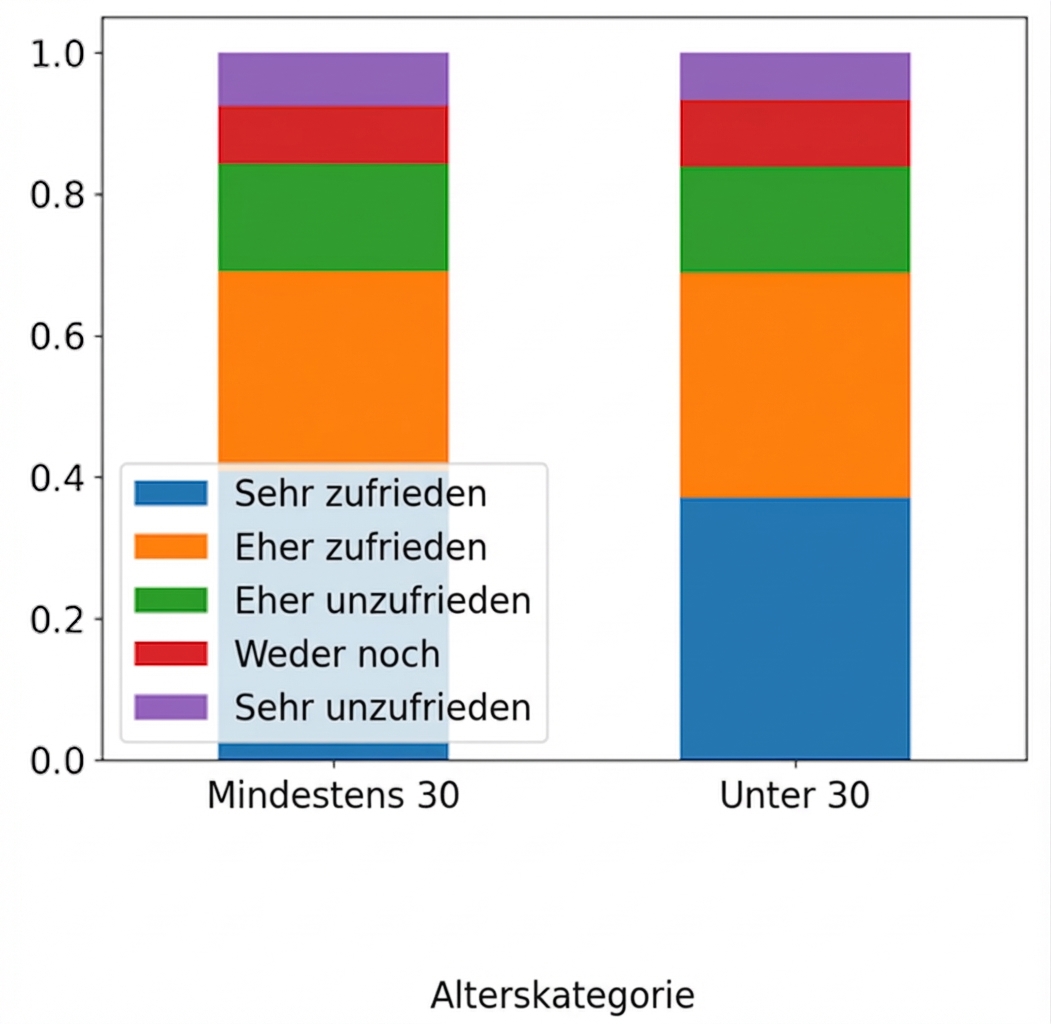
Variablen tauschen?
props = stack_overflow.groupby('age_cat')['job_sat'].value_counts(normalize=True)
wide_props = props.unstack()
wide_props.plot(kind="bar", stacked=True)
Variablen tauschen?
Chi-Quadrat in beide Richtungen
expected, observed, stats = pingouin.chi2_independence(data=stack_overflow, x="age_cat", y="job_sat")
print(stats[stats['test'] == 'pearson'])
      test  lambda      chi2  dof      pval    cramer     power
0  pearson     1.0  5.552373  4.0  0.235164  0.049555  0.437417
Frage: Sind die Variablen X und Y unabhängig?
Nicht: Ist Variable X unabhängig von Variable Y?
Richtung und Verteilungsschwanz?
- Beobachtete und erwartete quadrierte Häufigkeiten sind nie negativ
- Chi-Quadrat-Tests sind fast immer rechtsseitig$^{1}$
1 Linksschränzige Chi-Quadrat-Tests werden in der forensischen Statistik genutzt, um verdächtig gute Anpassungen durch Datenfälschung zu erkennen. Varianztests mit Chi-Quadrat können zweiseitig sein. Das sind jedoch Nischenanwendungen.
Lass uns üben!
Hypothesentests in Python

