Hypothesentests und z‑Scores
Hypothesentests in Python

James Chapman
Curriculum Manager, DataCamp
A/B‑Testing

1 Bildnachweis: „Electronic Arts“ von majaX1 CC BY-NC-SA 2.0
A/B‑Test auf einer Retail‑Seite
Kontrollgruppe:

Treatment:

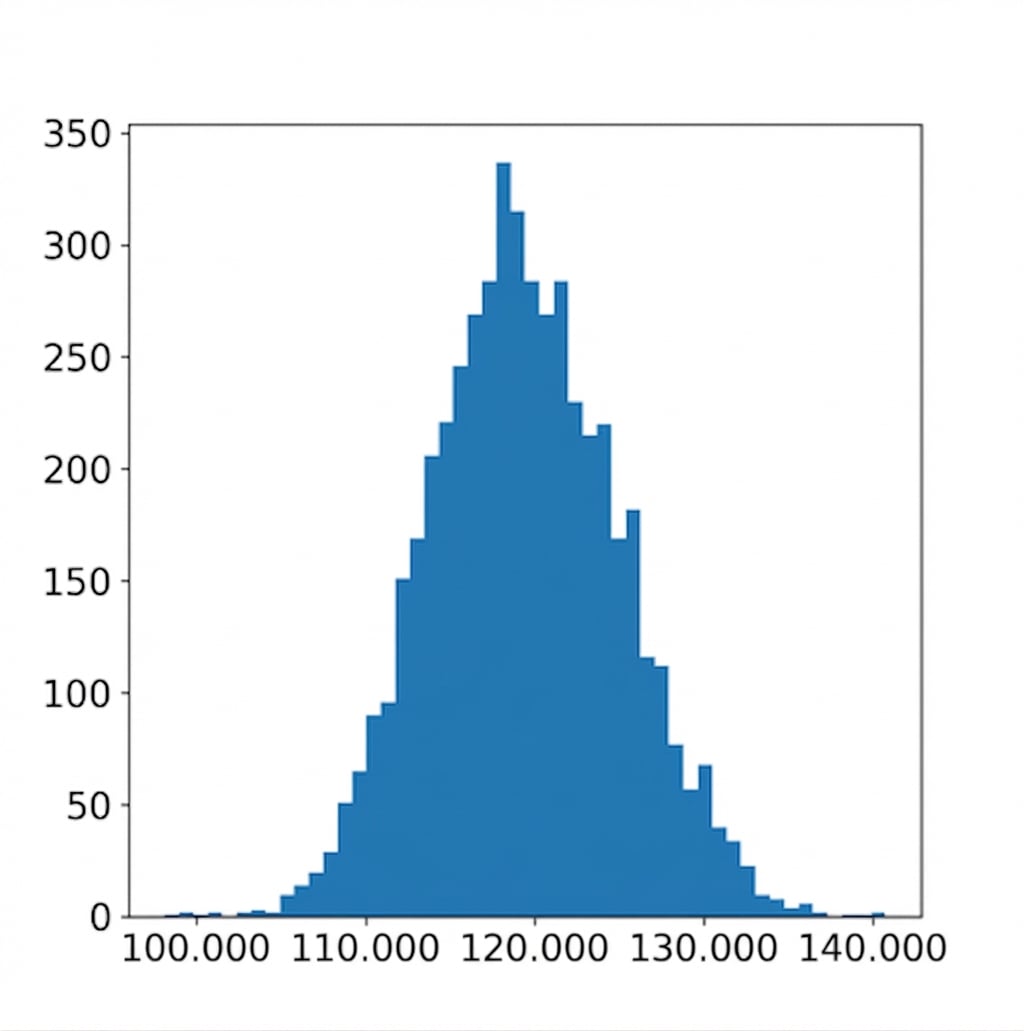
Bootstrap-Verteilung visualisieren
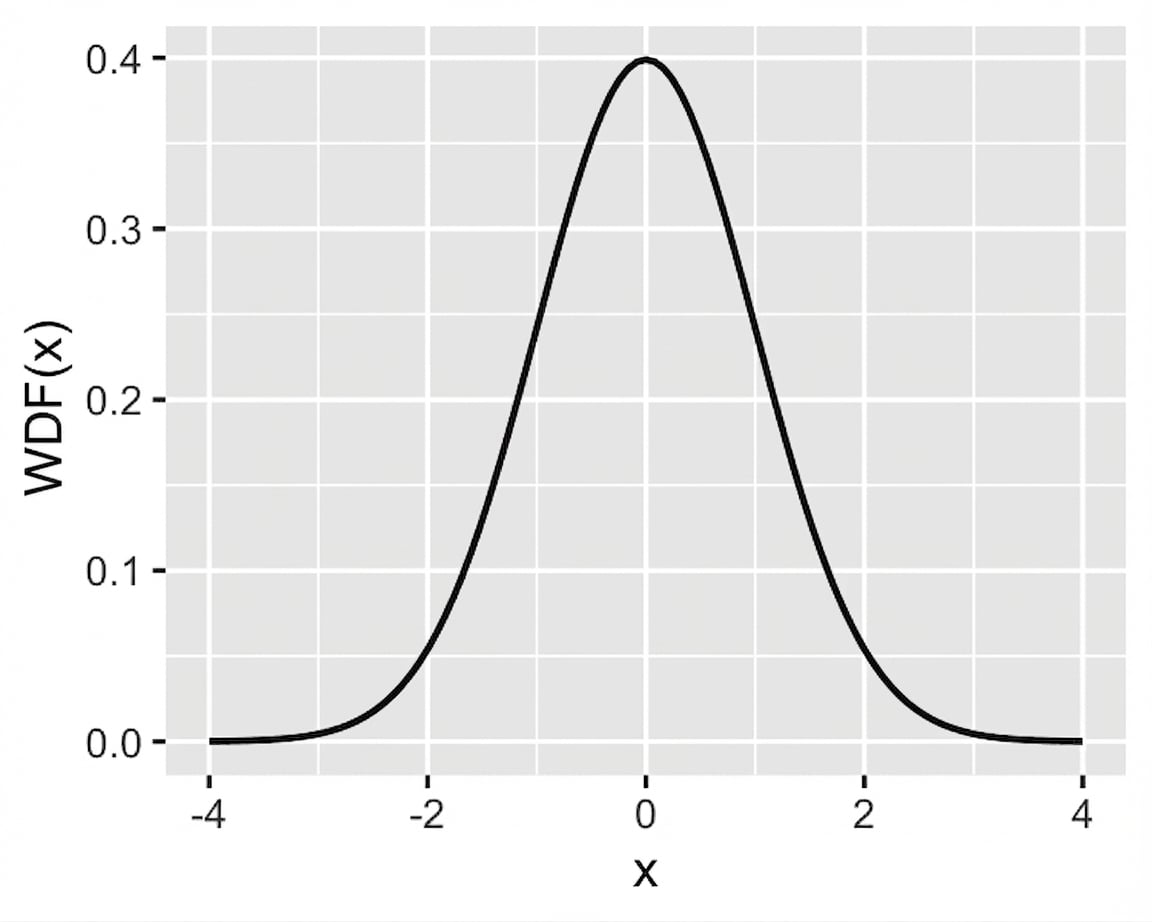
Standardnormale (z)‑Verteilung
Standardnormalverteilung: Normalverteilung mit Mittelwert = 0 und Standardabweichung = 1