Etiquetas y orden de facetas
Visualización de datos intermedia con ggplot2

Rick Scavetta
Founder, Scavetta Academy
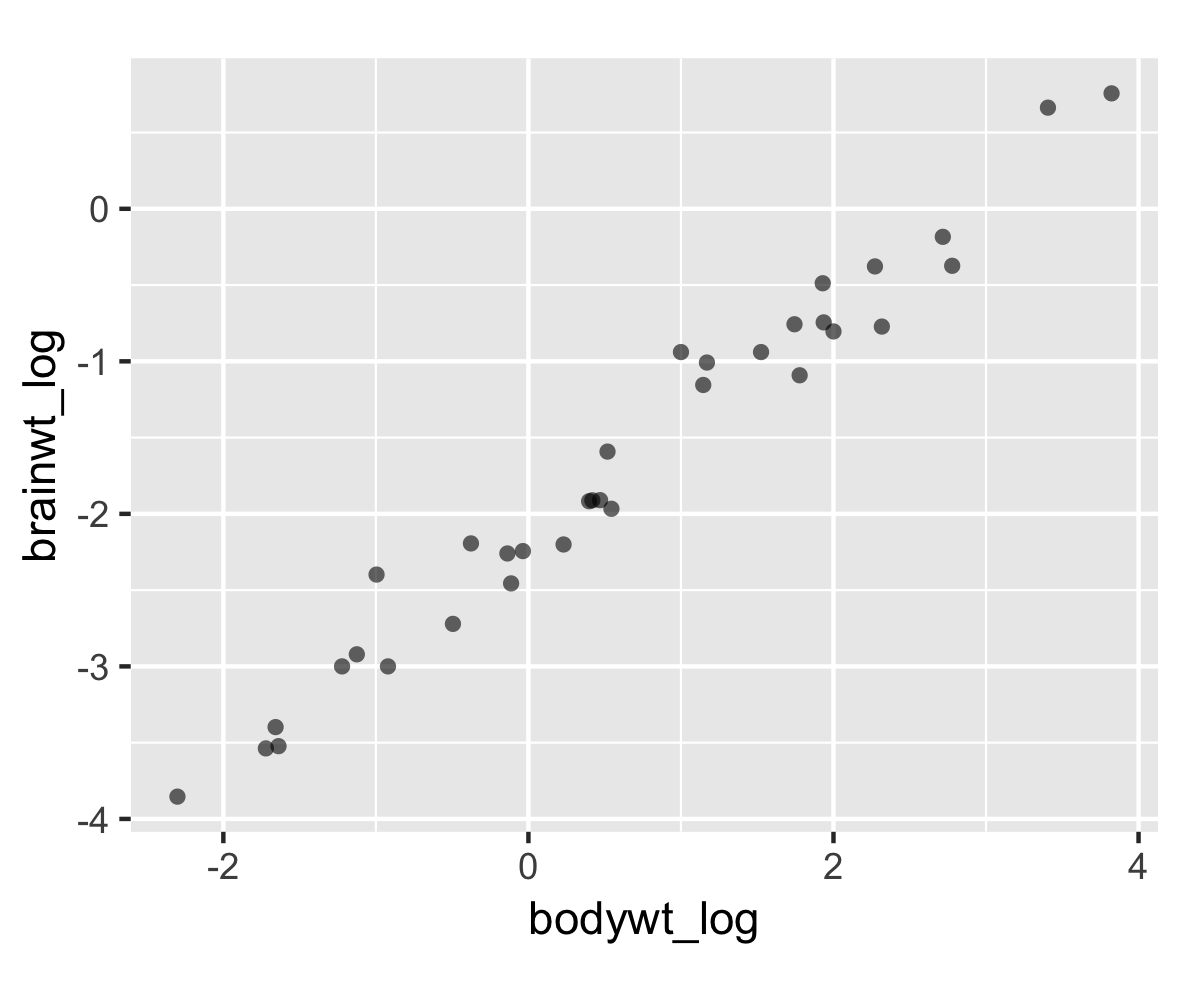
Un nuevo dataframe
Un nuevo dataframe, con facetas
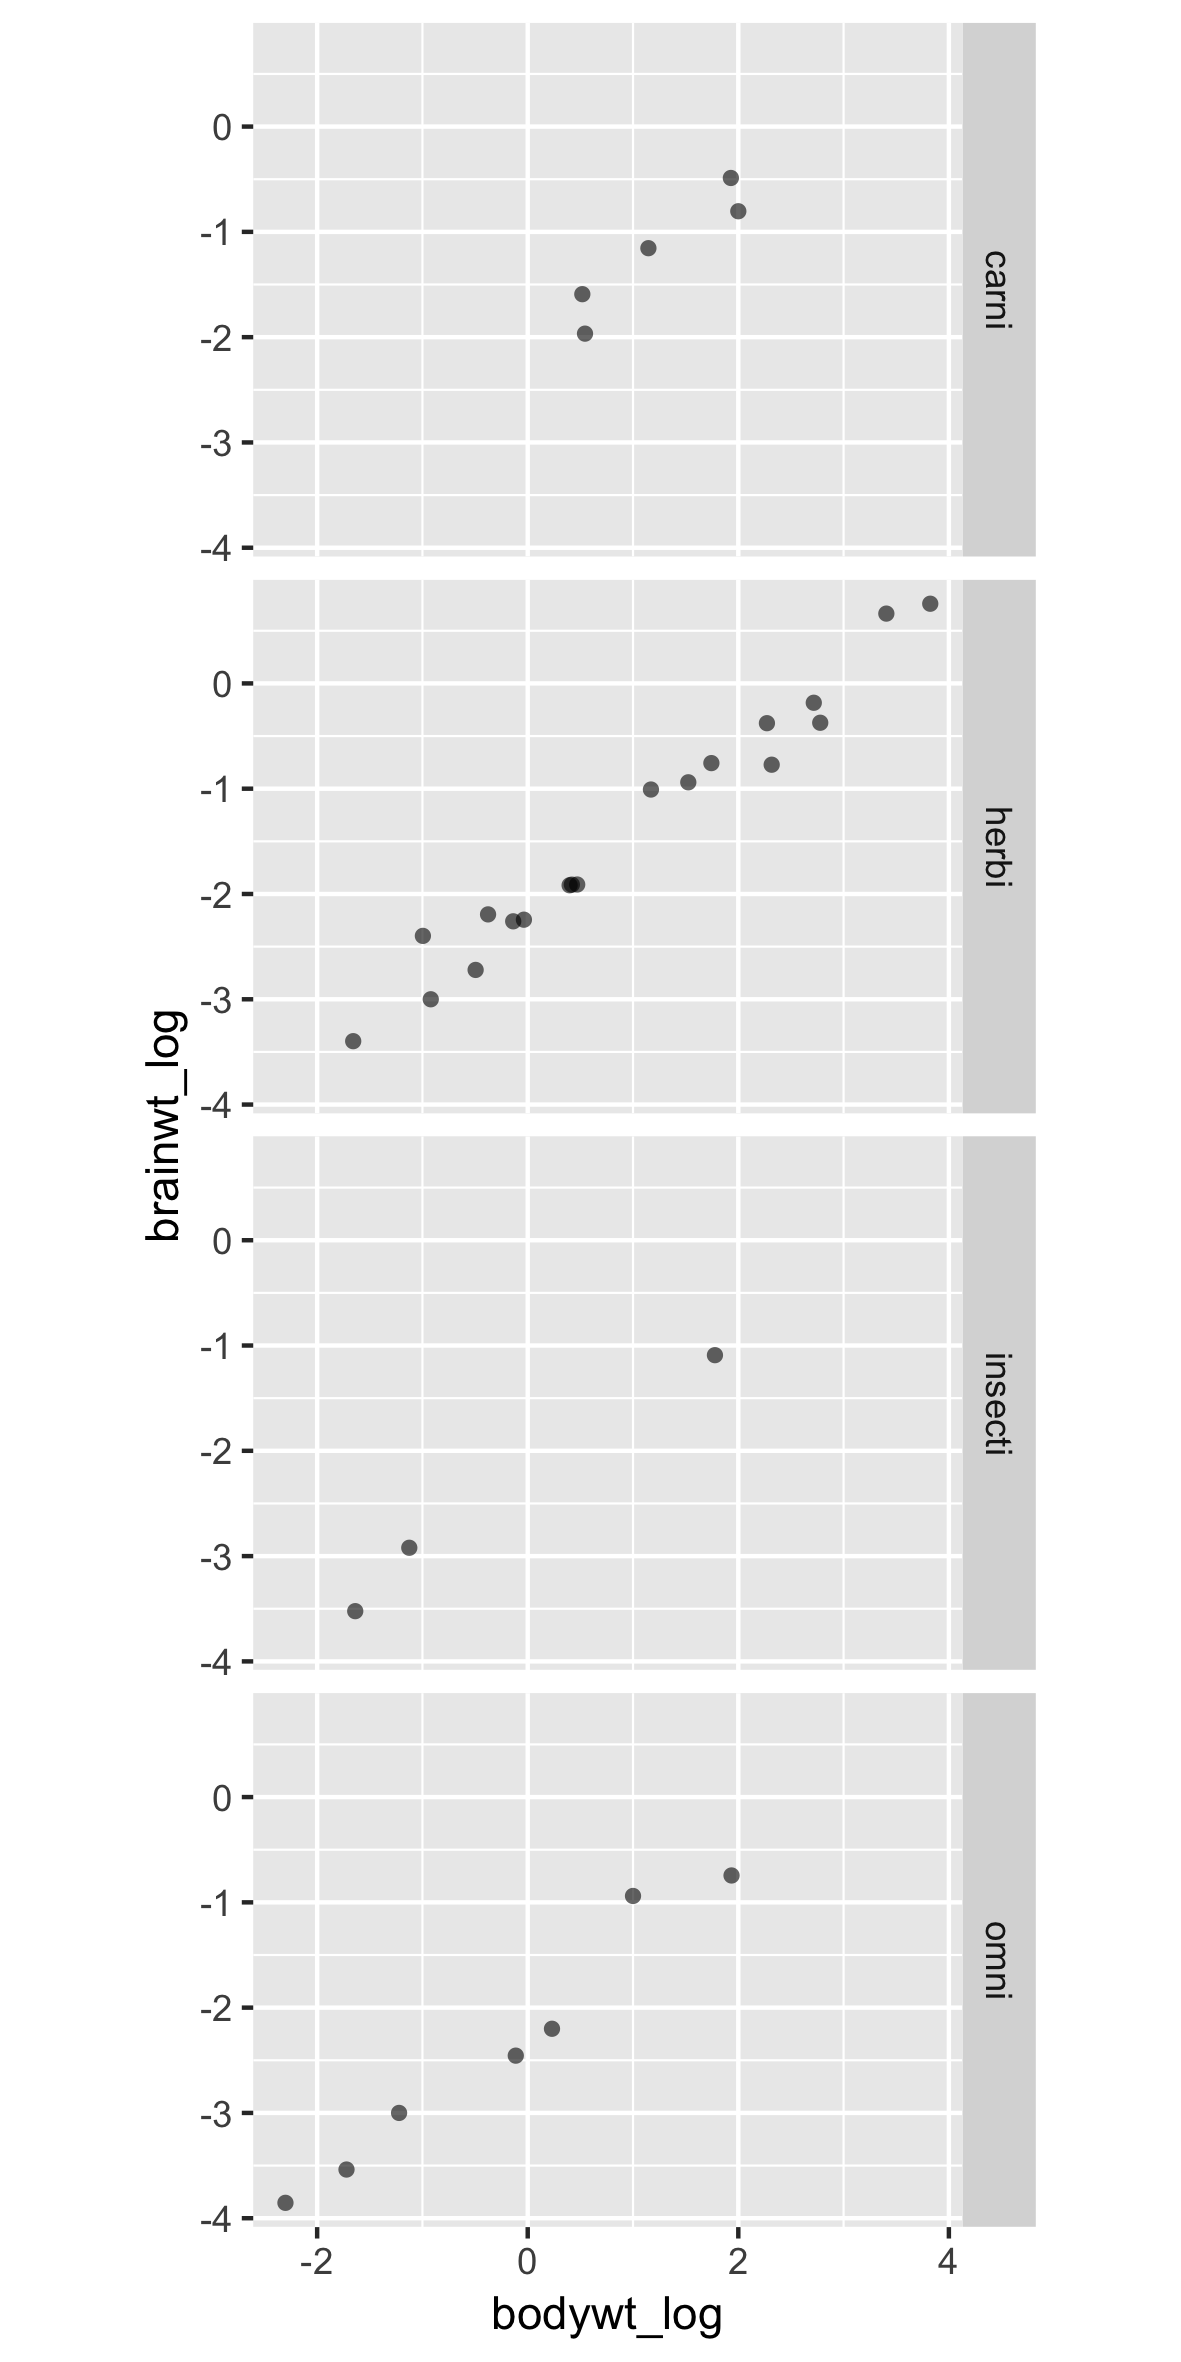
Un nuevo dataframe, con facetas
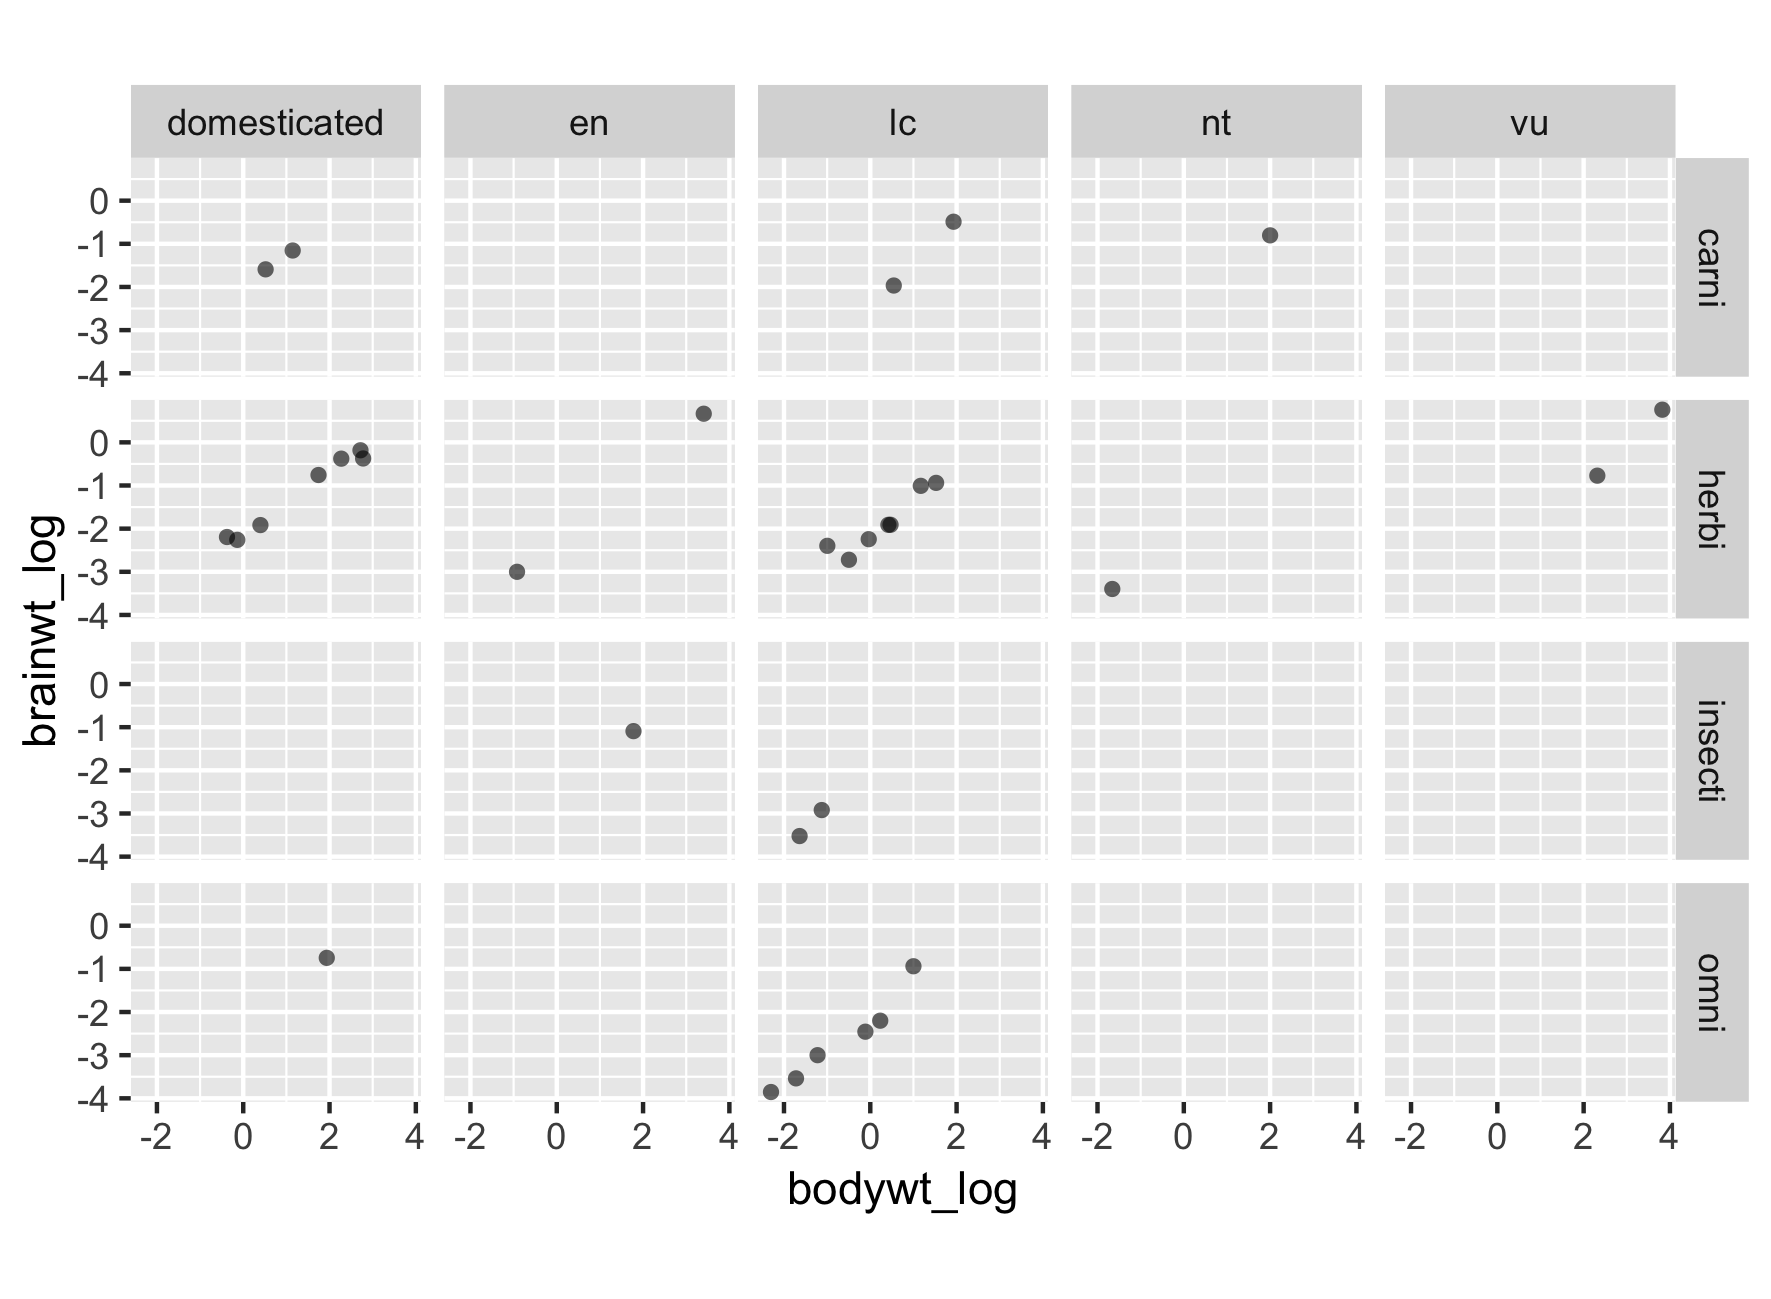
Malas etiquetas y mal orden
Malas etiquetas y mal orden
El argumento labeller

Usar label_both añade el nombre de la variable

Dos variables en un lado

Usar label_context evita ambigüedad

Usa filas y columnas cuando convenga
Usa filas y columnas cuando convenga
Usa filas y columnas cuando convenga
Reinicia el gráfico con nuevas etiquetas
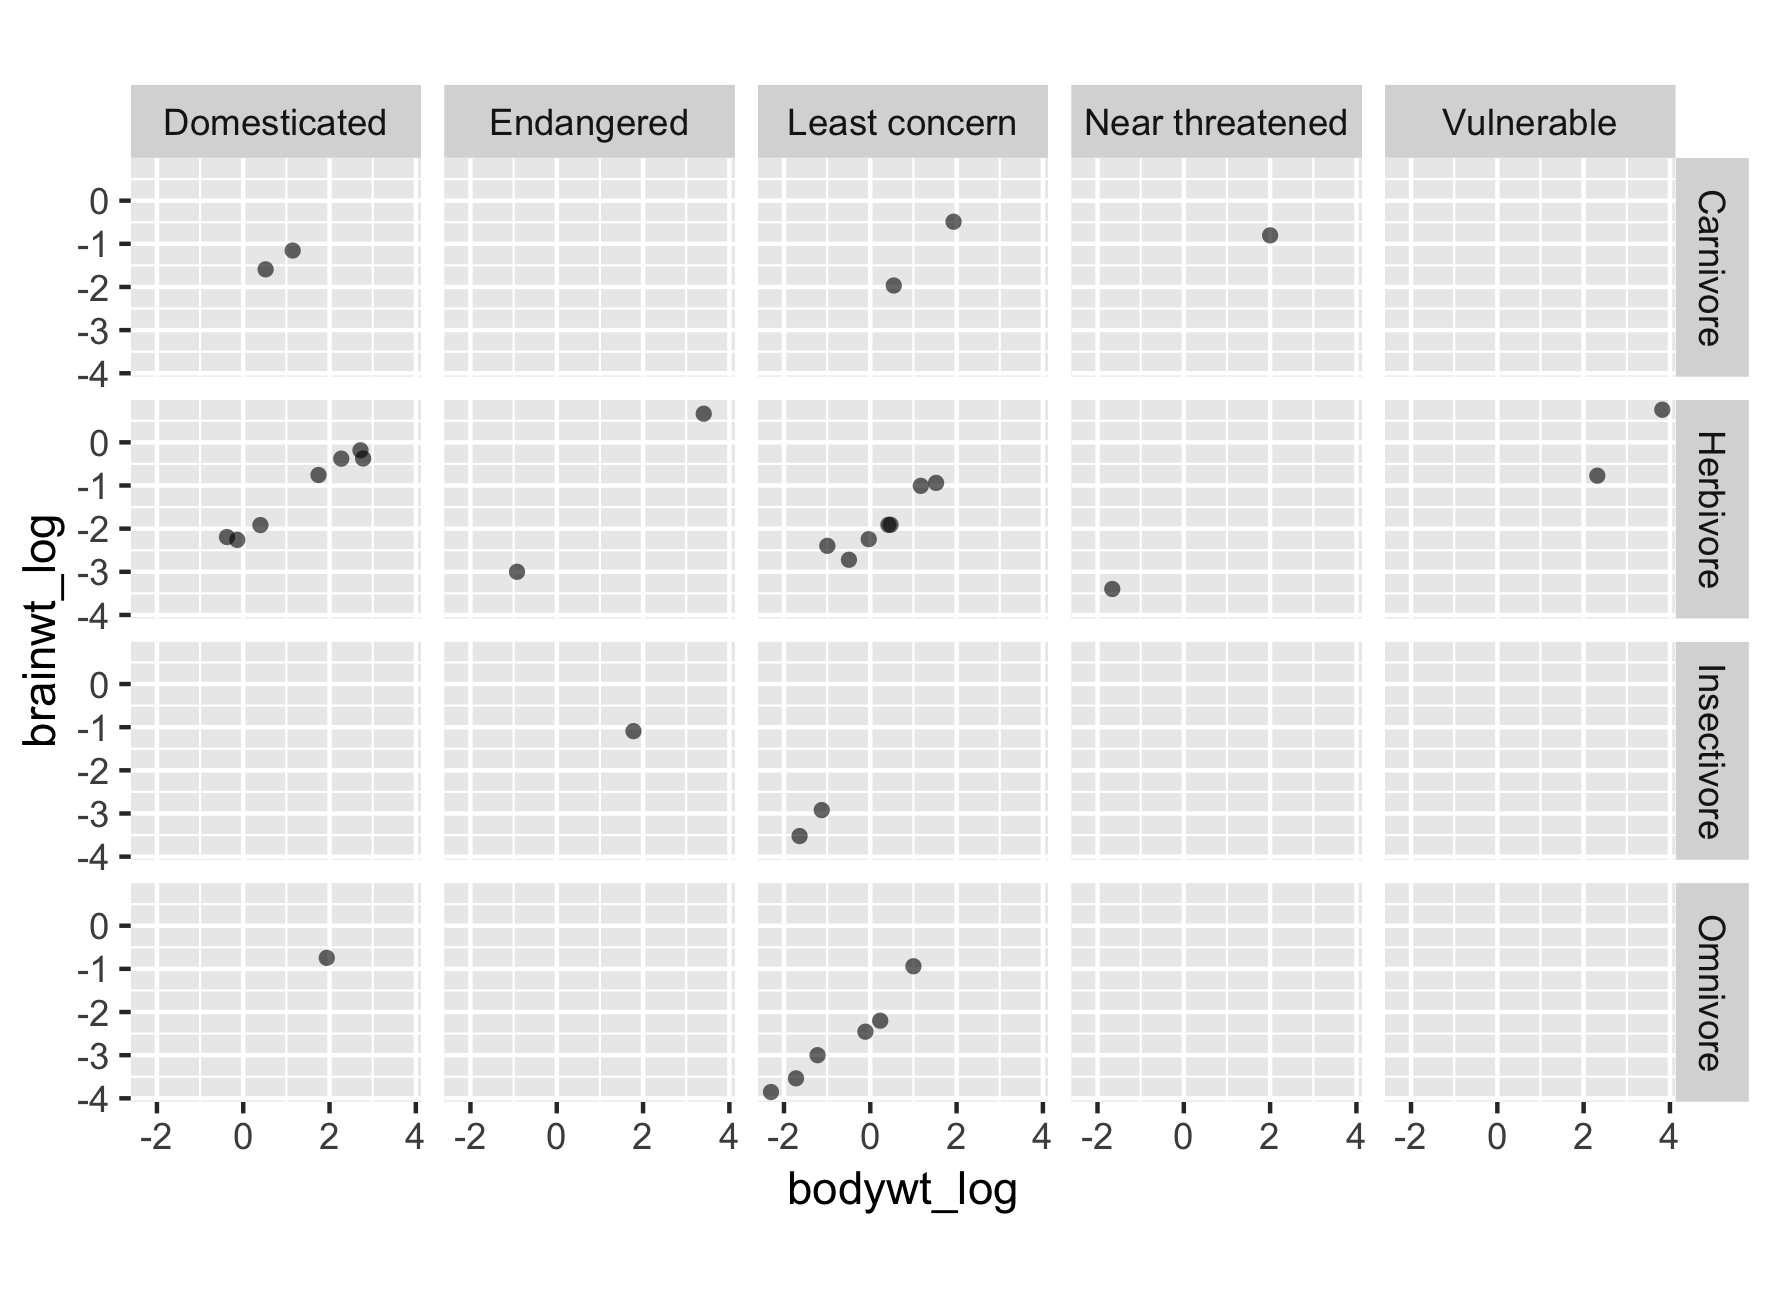
Reinicia el gráfico con nuevas etiquetas
Reinicia el gráfico con el nuevo orden


