Espacios de trazado por facetas
Visualización de datos intermedia con ggplot2

Rick Scavetta
Founder, Scavetta Academy
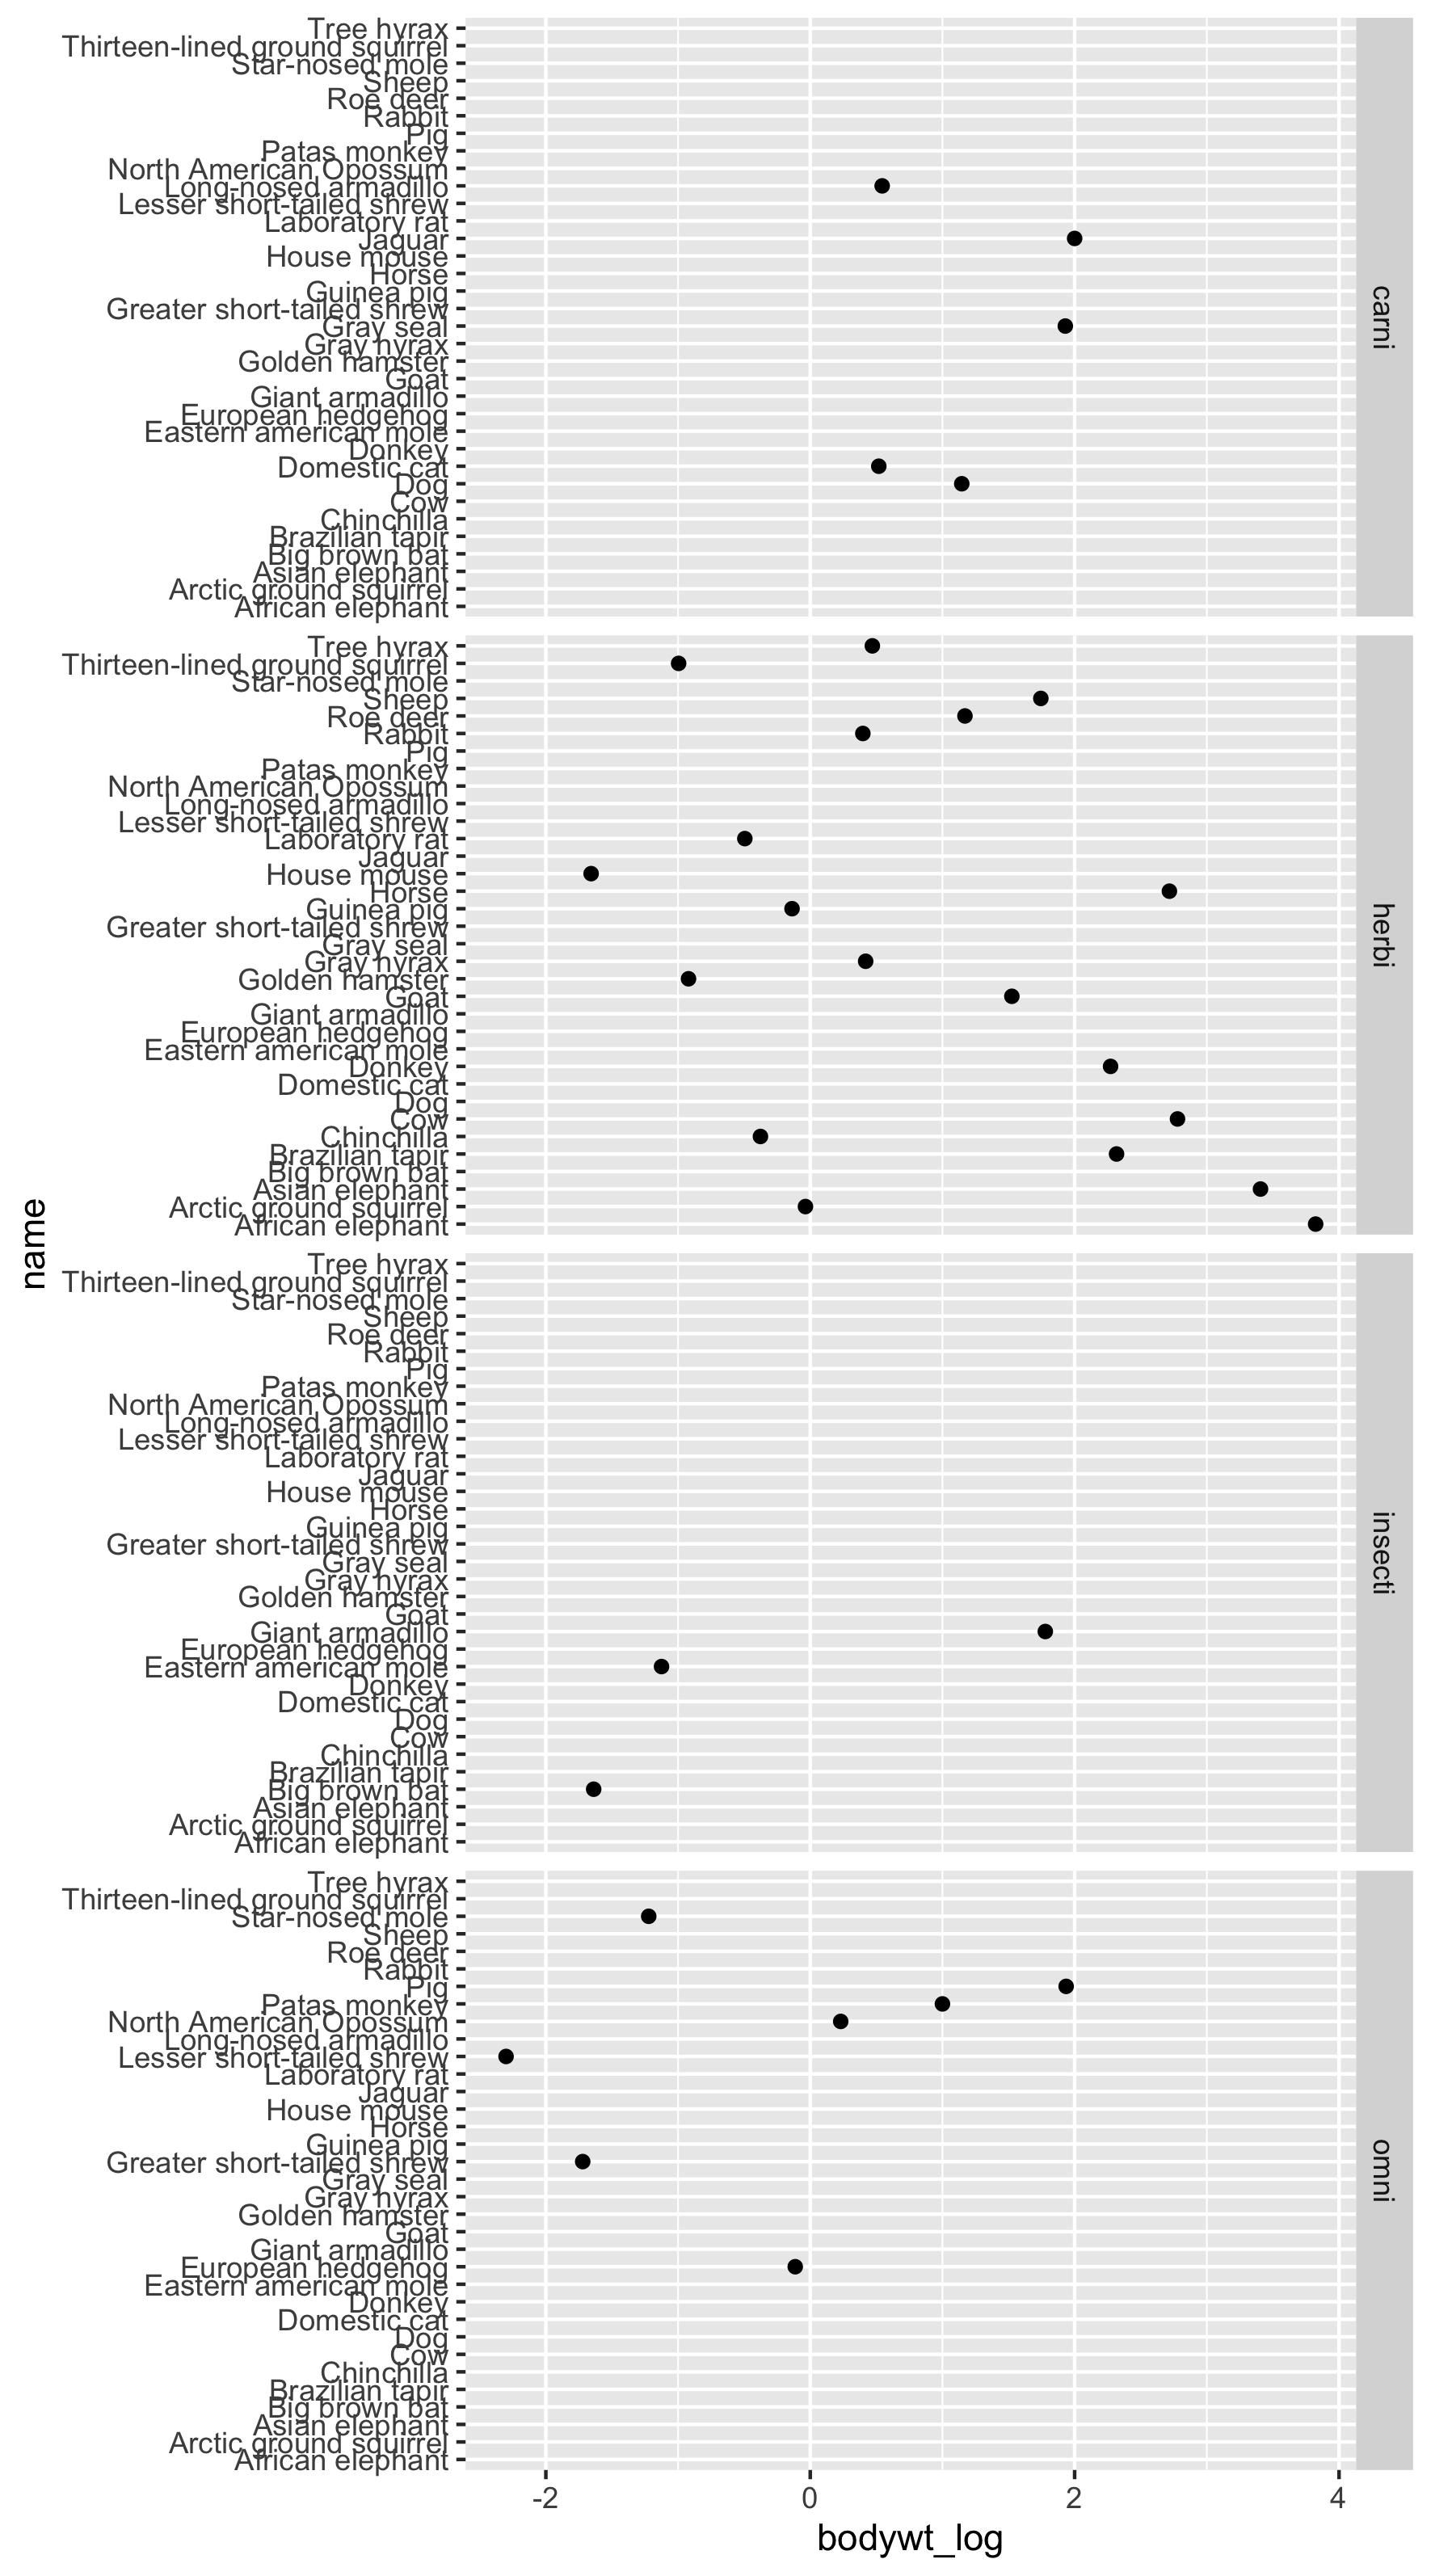
Ajustar el espacio de trazado...
Ajustar el espacio de trazado
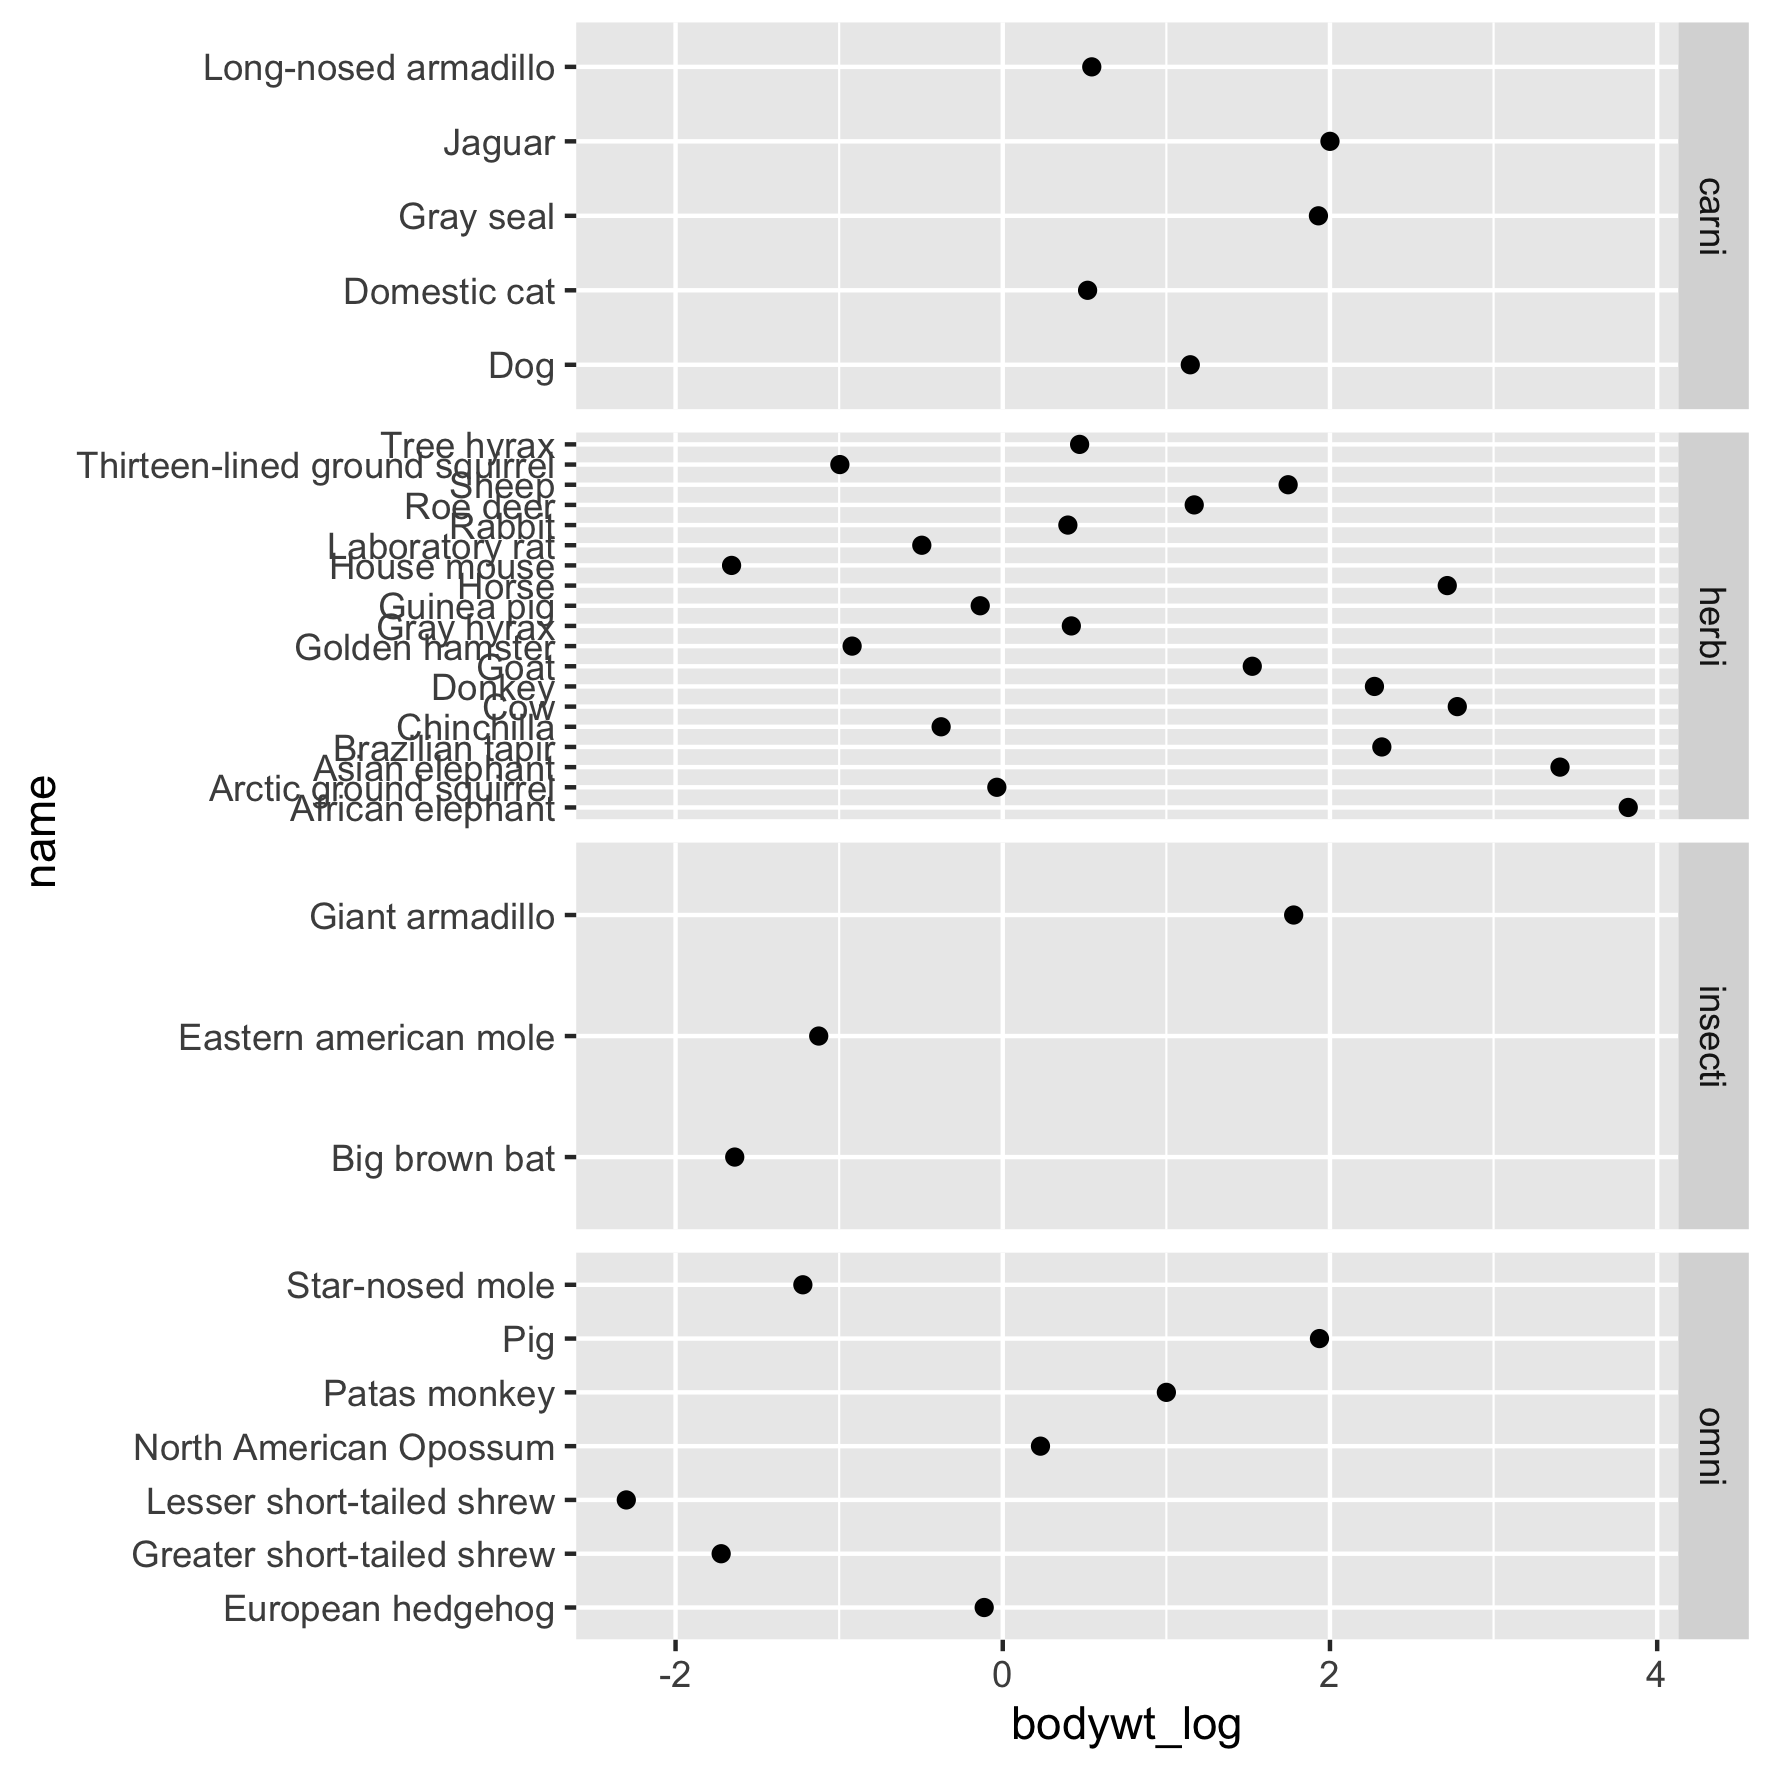
Ajustar el espacio de trazado

Ajustar el espacio de trazado
Ajustar el espacio de trazado
Ajustar el espacio de trazado
Ajustar el espacio de trazado
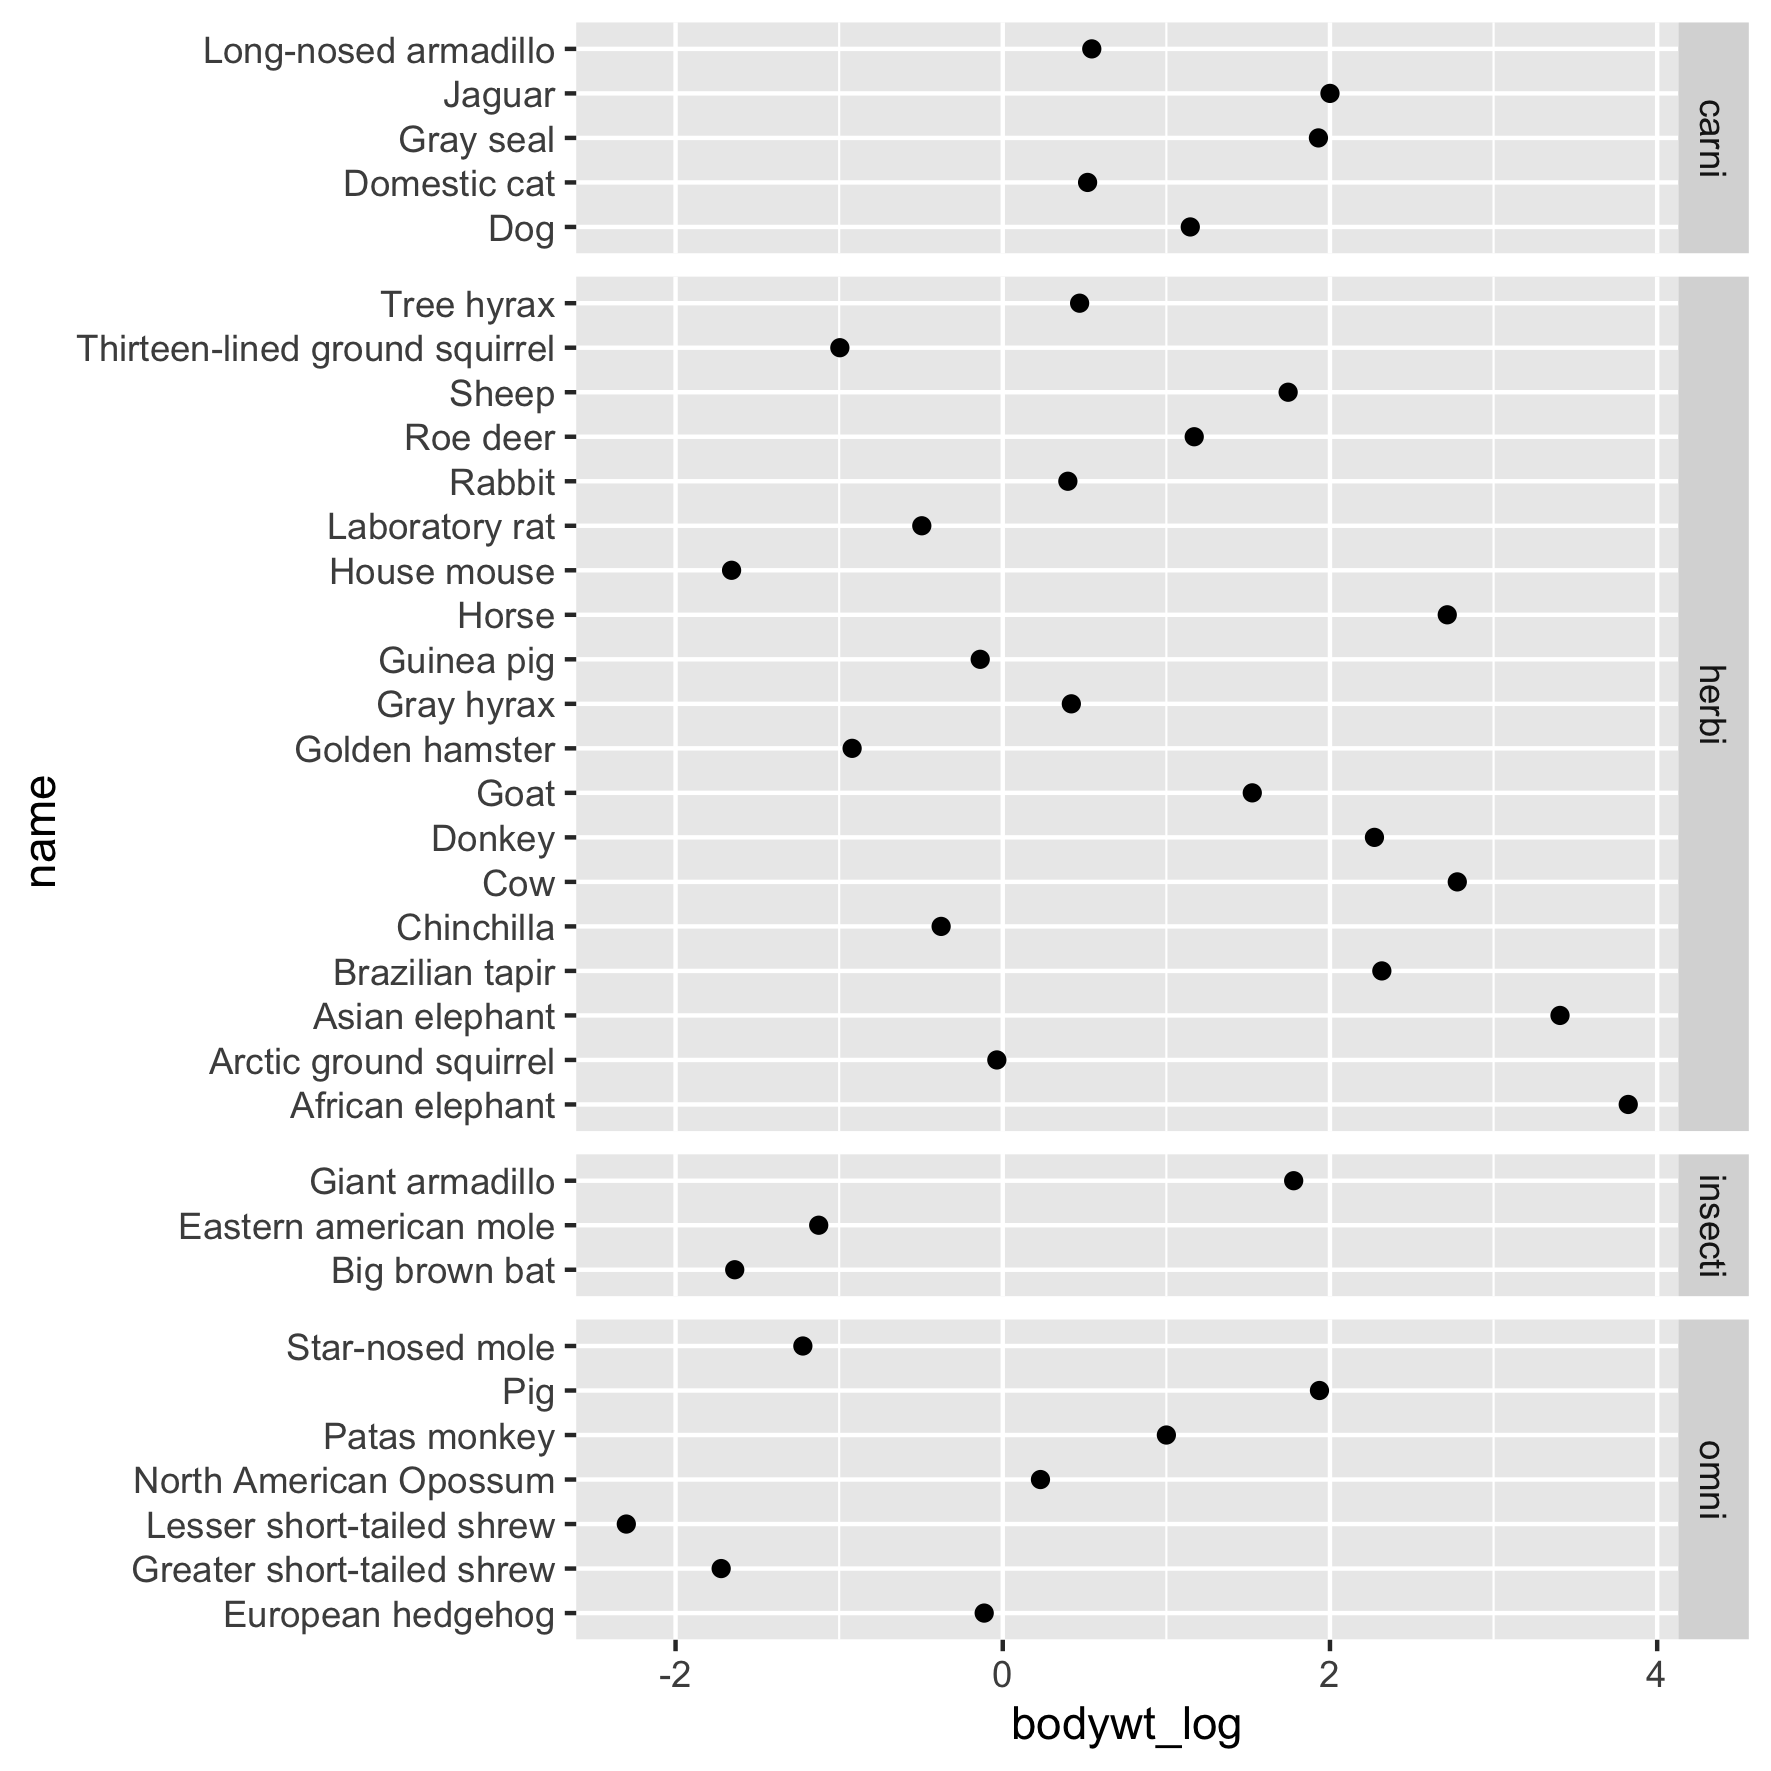
Ajustes finales