Querying data visually
Introduction to Microsoft Fabric
Fiodar Sazanavets
Senior Software Engineer
The benefits of querying data visually
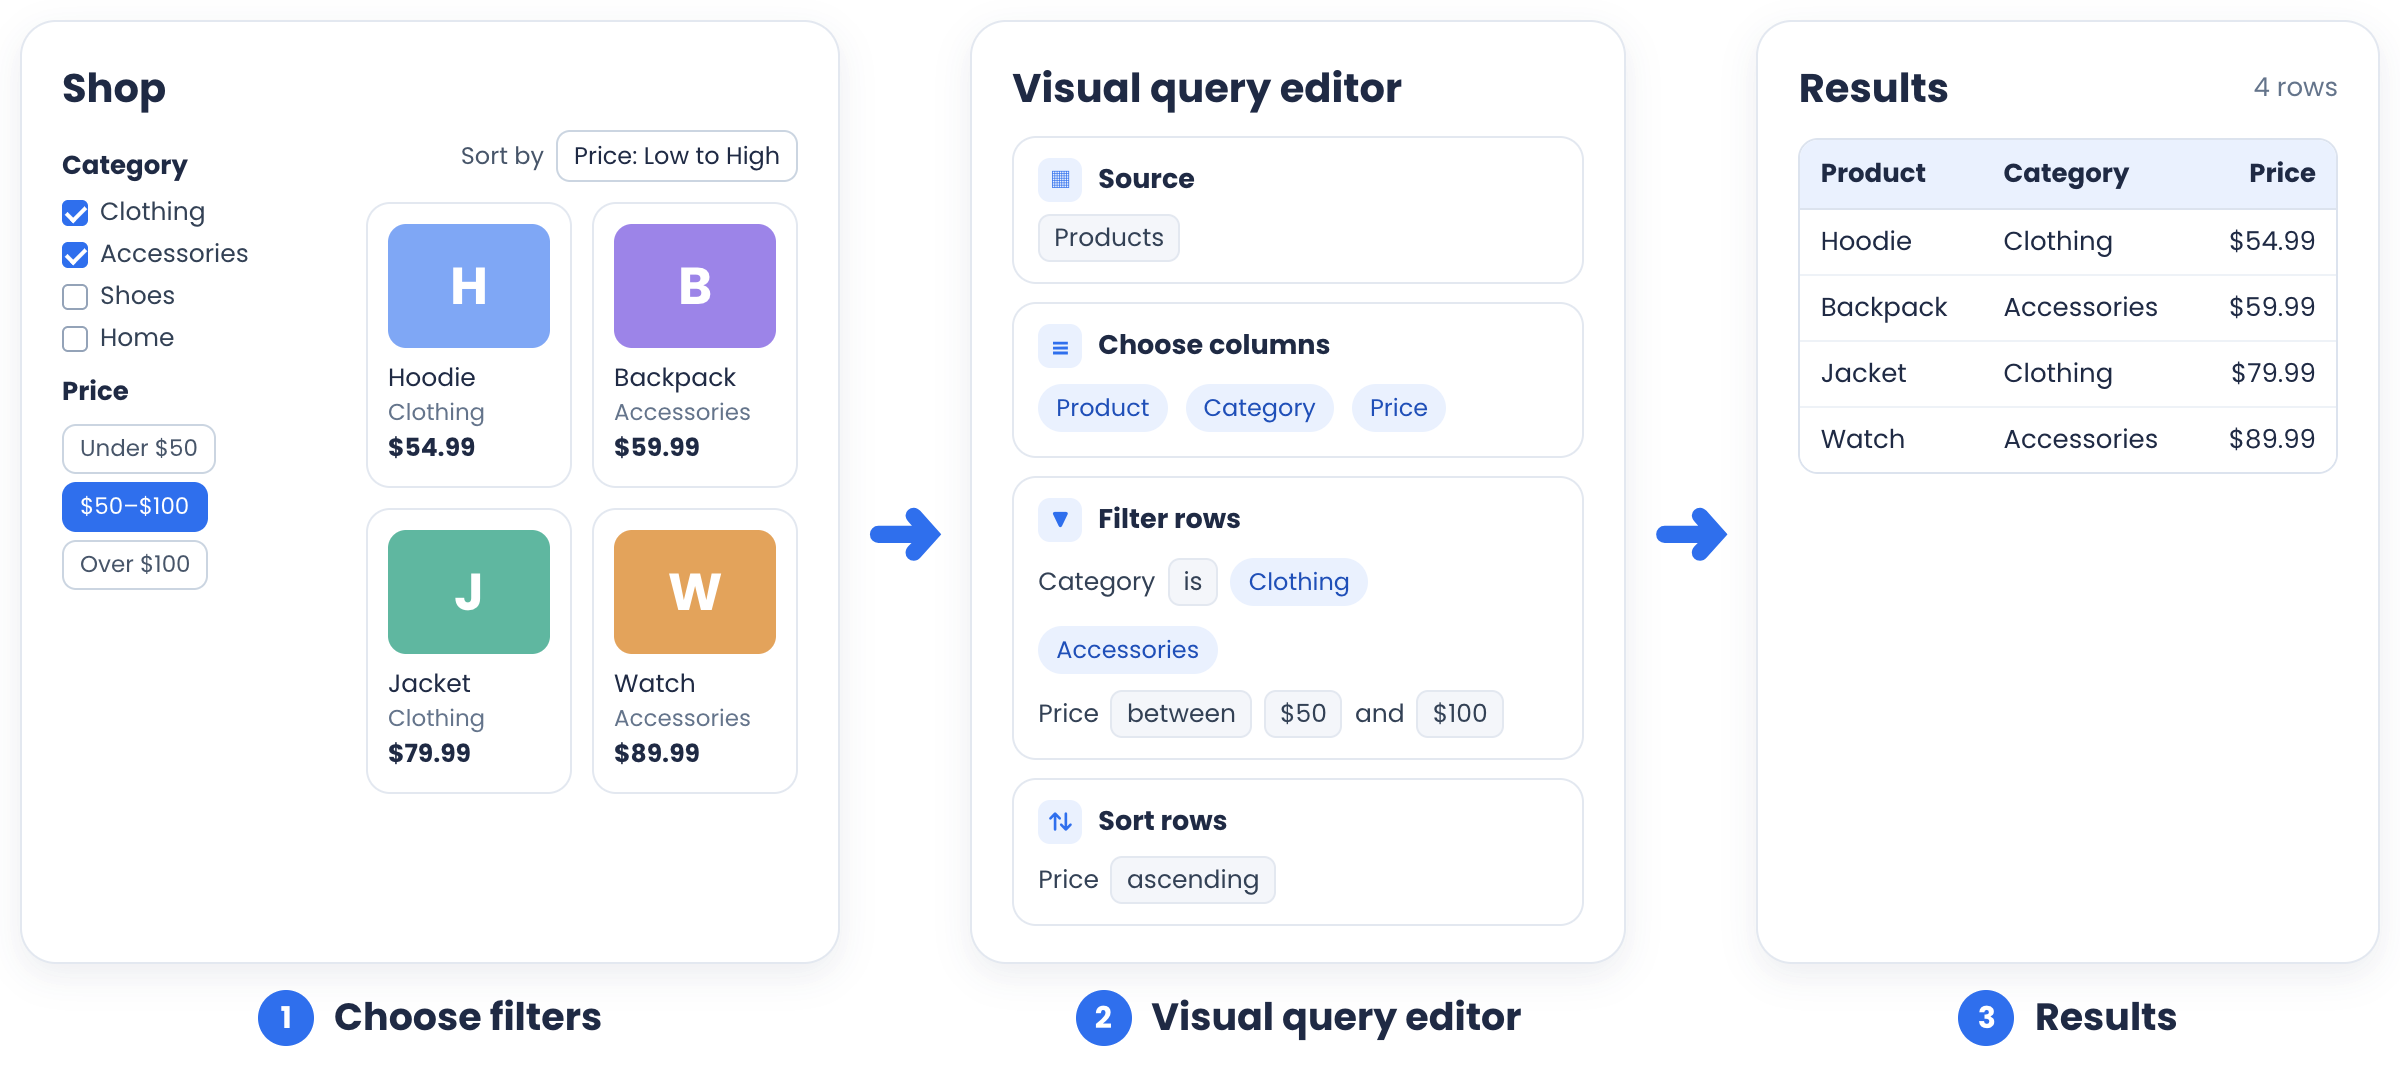
Why visual query authoring helps
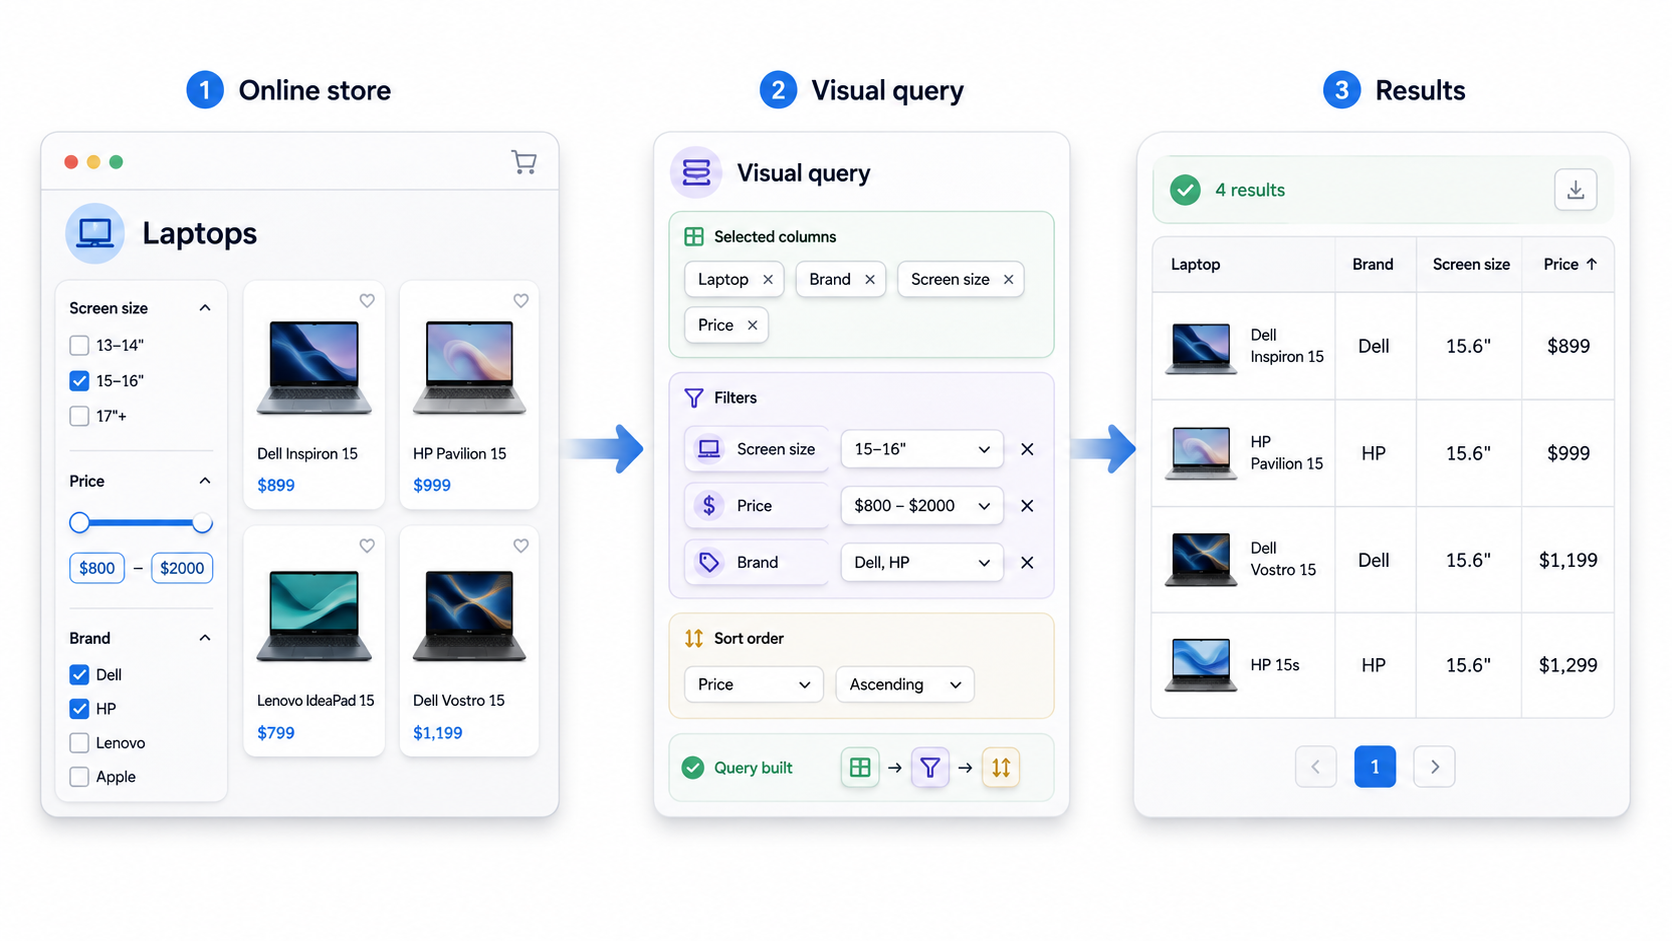
No SQL syntax needed
Breaks the query into visible steps
Can revisit and change any step
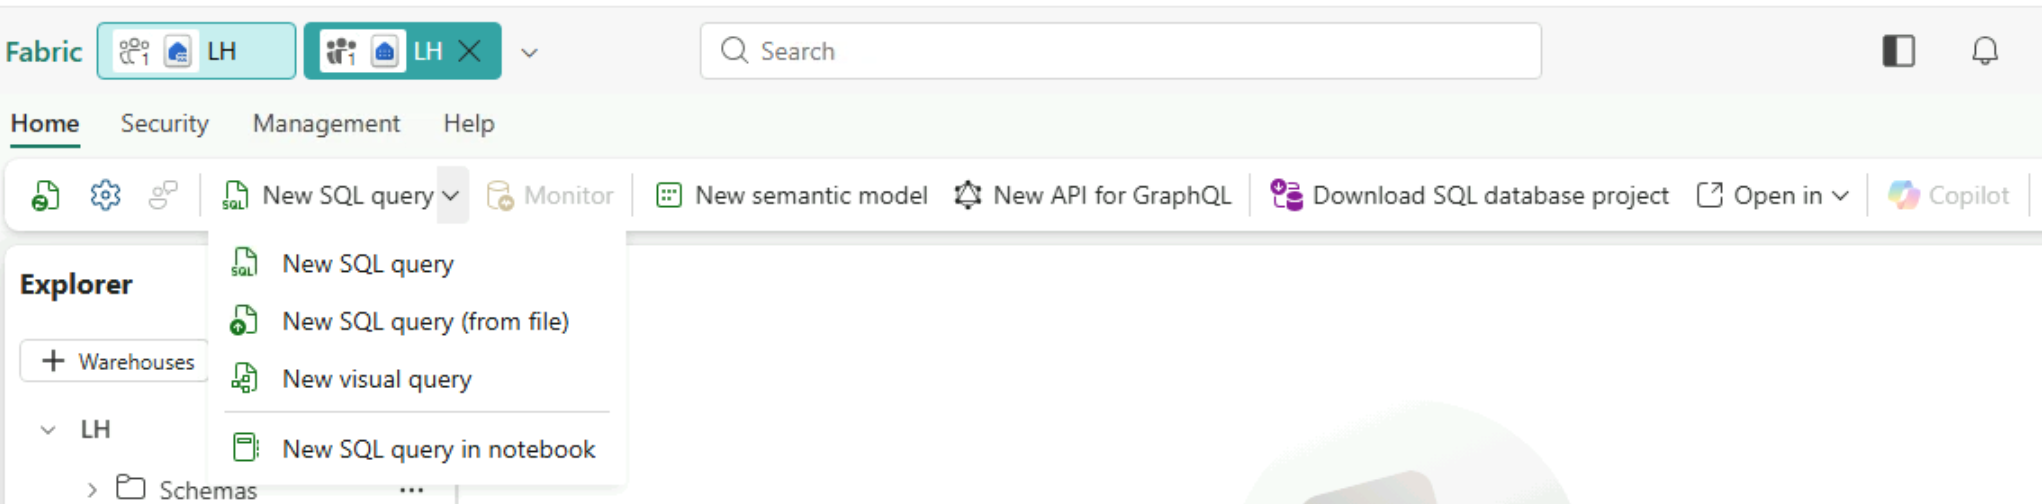
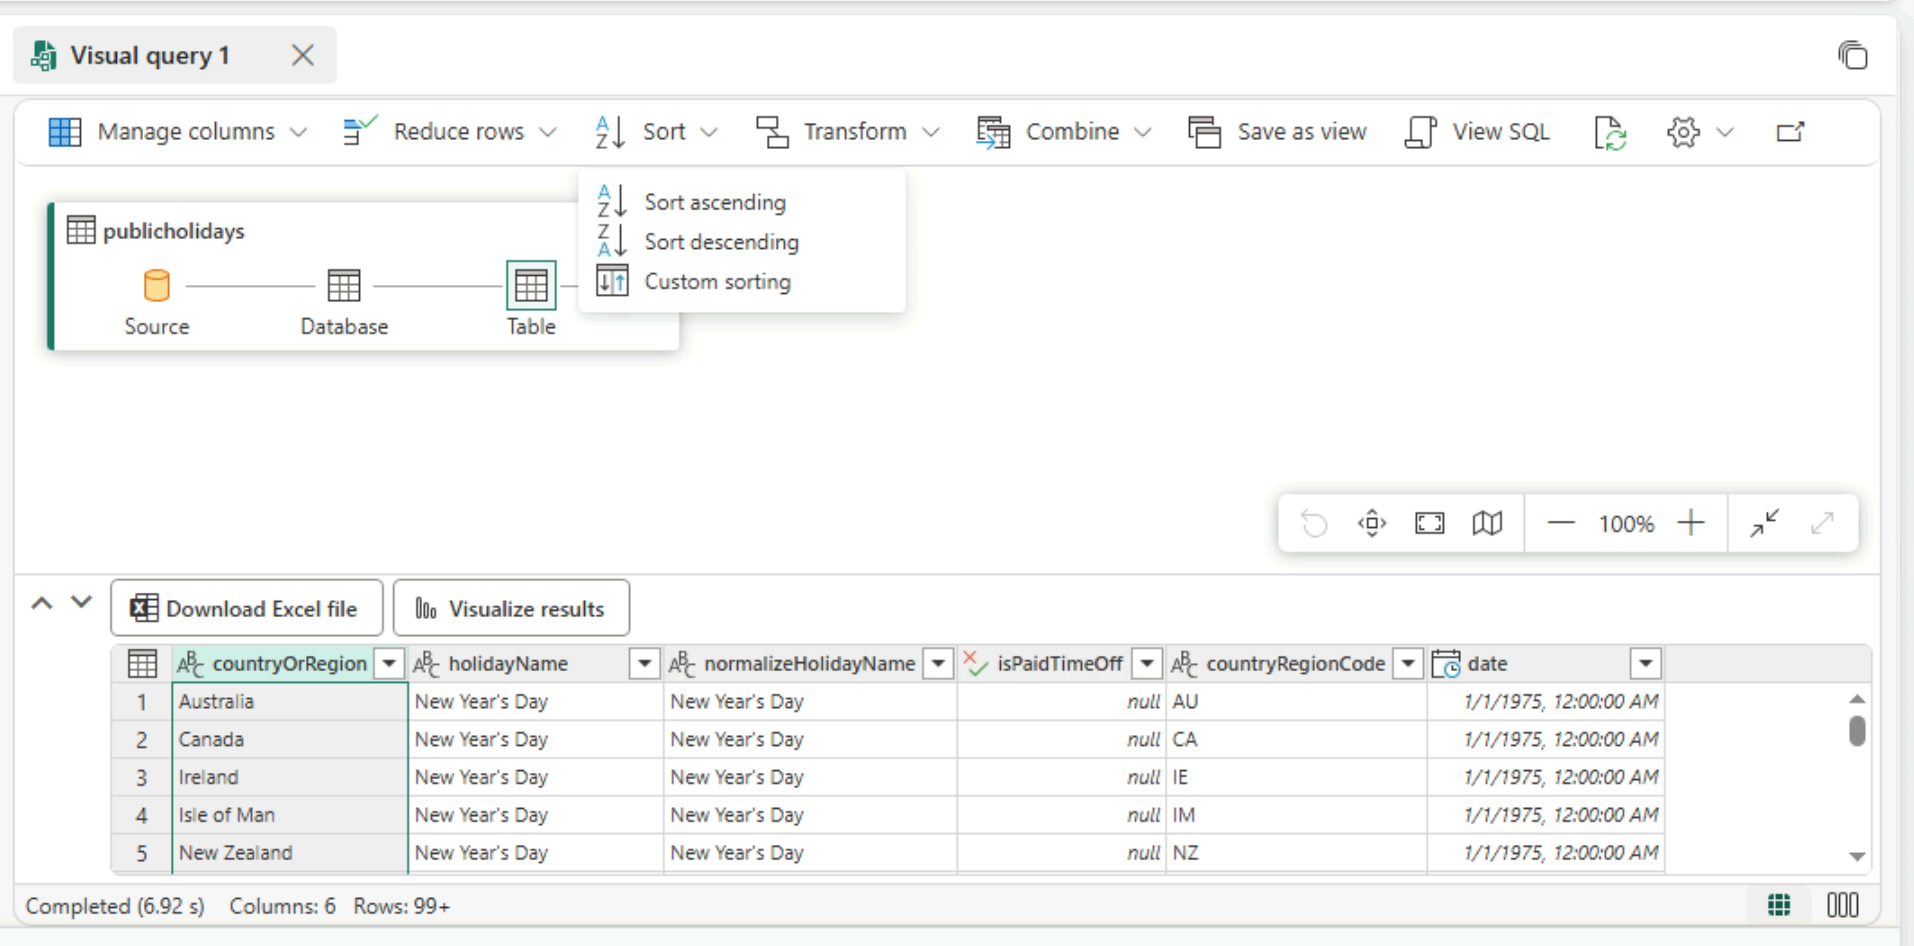
Accessing the visual query editor
In lakehouses (via SQL analytics endpoint) and warehouses
New SQL query
dropdown on the ribbon
Visual query editor layout
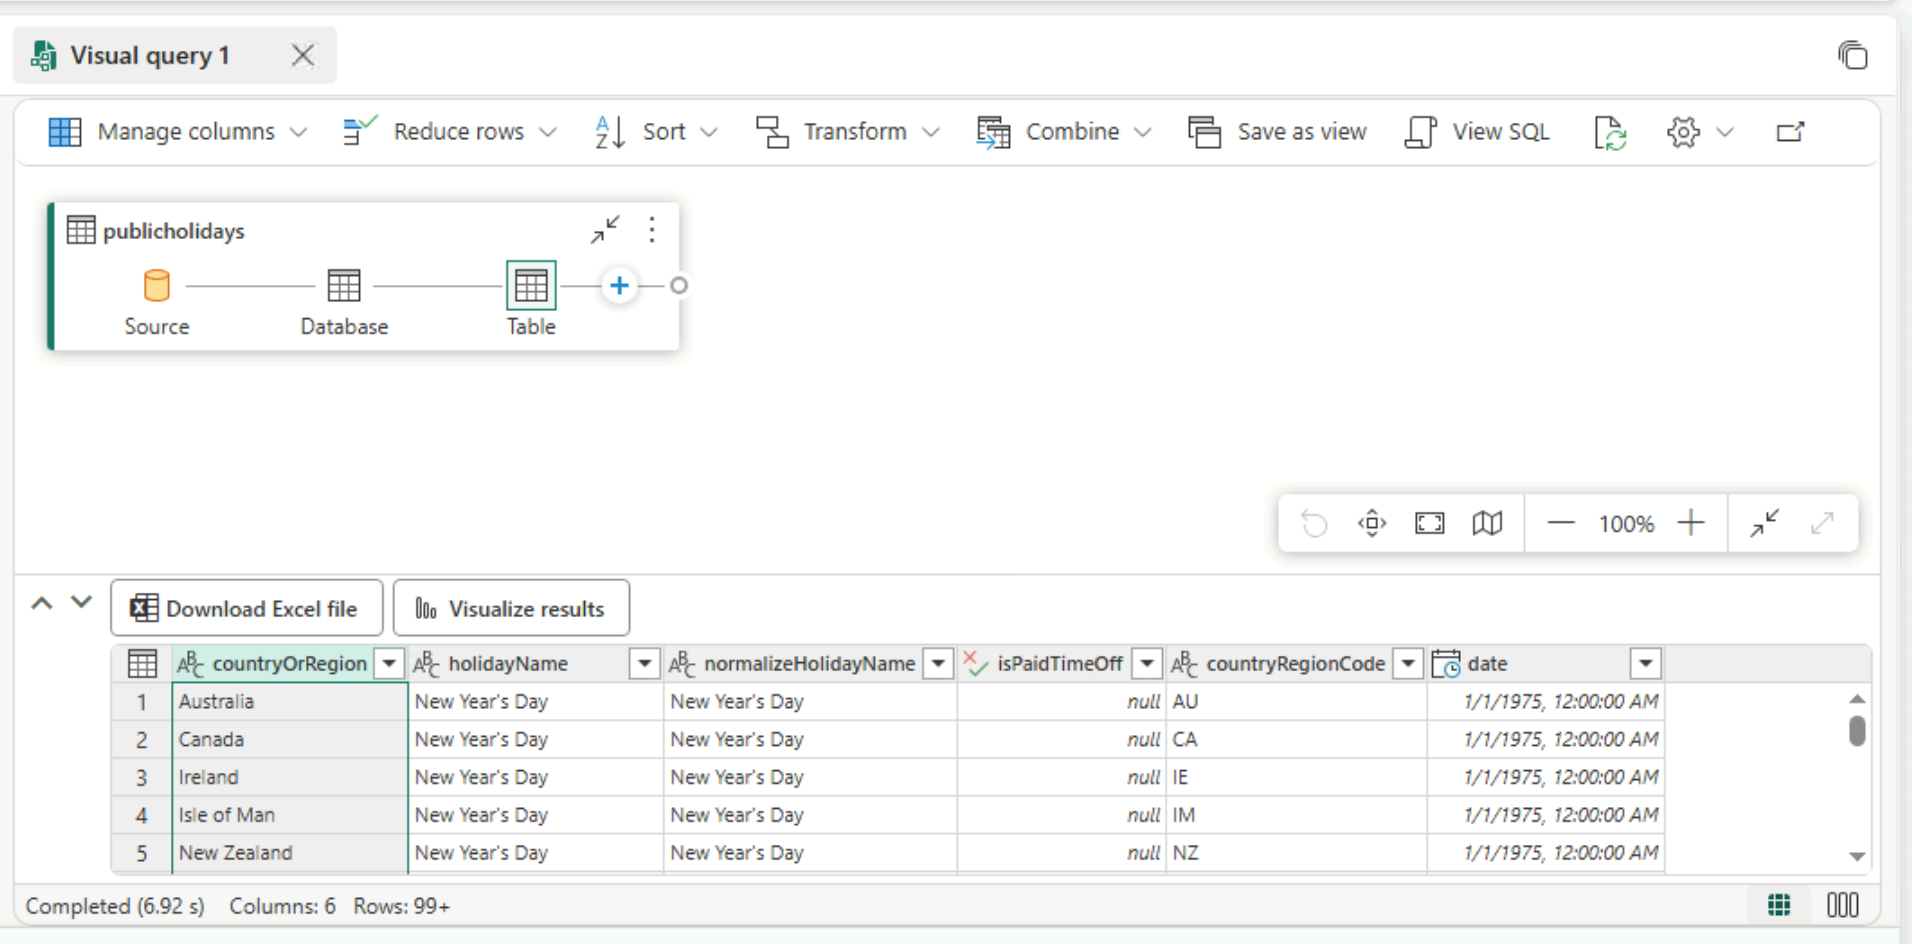
Data source: the table you start from
Steps: what you apply to it
Preview: the live result
Check each step before adding the next
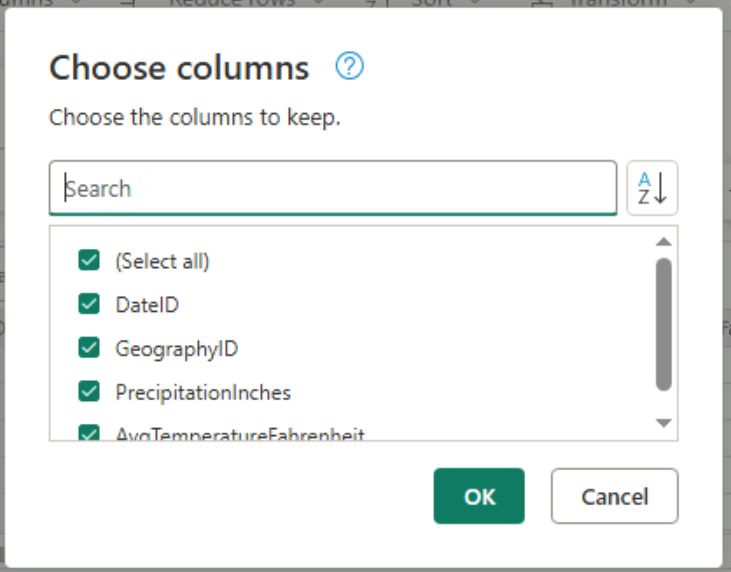
Selecting columns visually
Check the fields you need
Others drop from the preview
Manage columns
menu
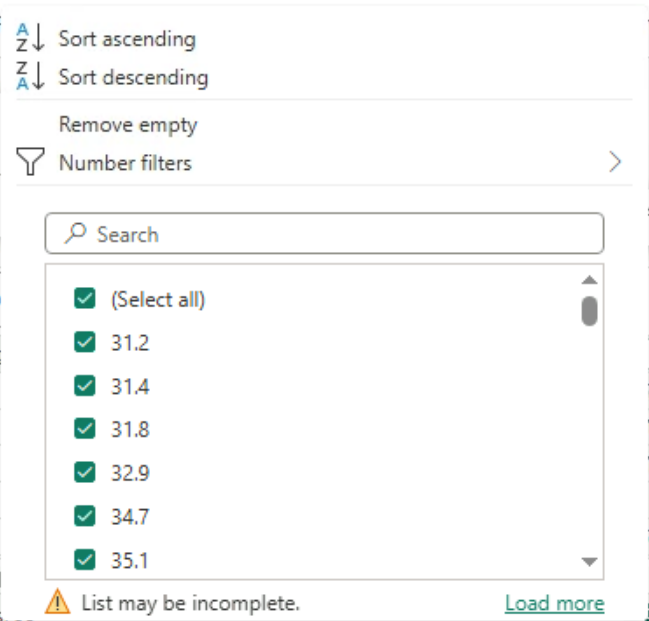
Adding a filter visually
Choose a field
Select a condition
Enter or choose a value
Keep matching records
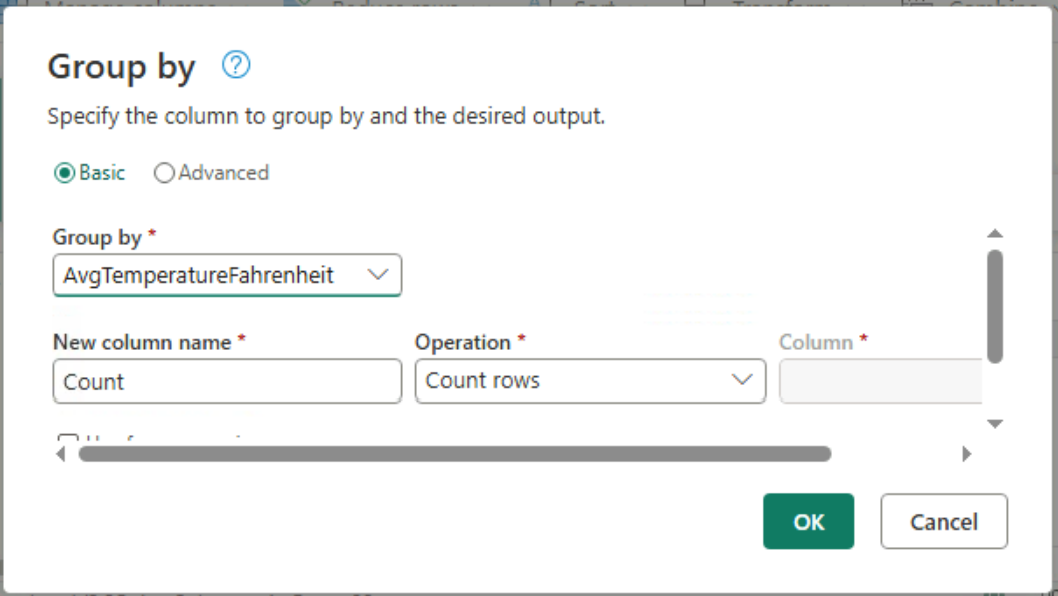
Grouping data visually
Summarize by category
Pick a column and a calculation (Ex. sum)
Sales by department: one total each
Sorting and previewing
Ascending or descending order
Preview confirms the result
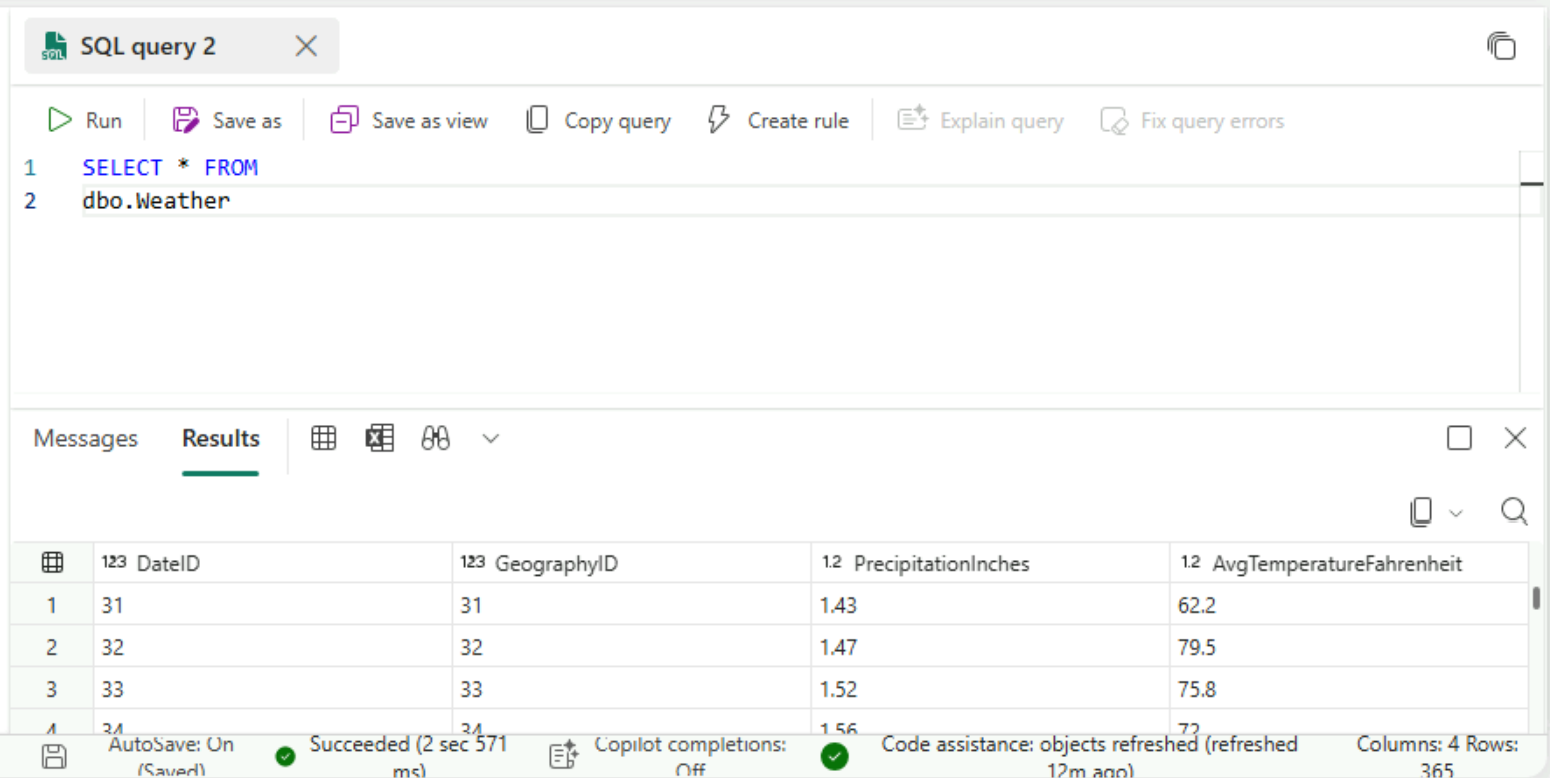
SQL or visual query?
SQL
Expresses any query
Suits complex logic
Visual query
Builds the query step by step
Suits unfamiliar data
Let's practice!
Introduction to Microsoft Fabric
Preparing Video For Download...