Medidas de dispersão
Introdução à estatística em Python

Maggie Matsui
Content Developer, DataCamp
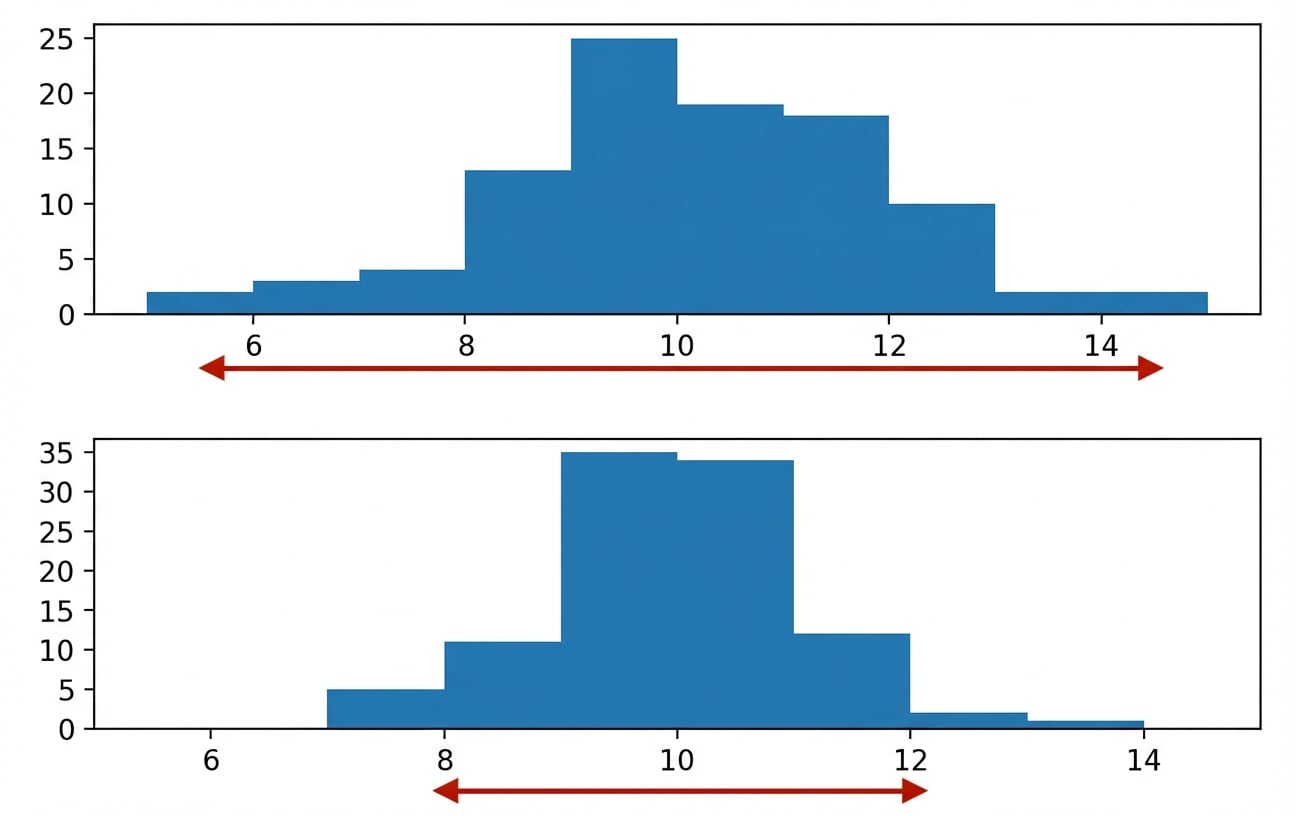
O que é dispersão?
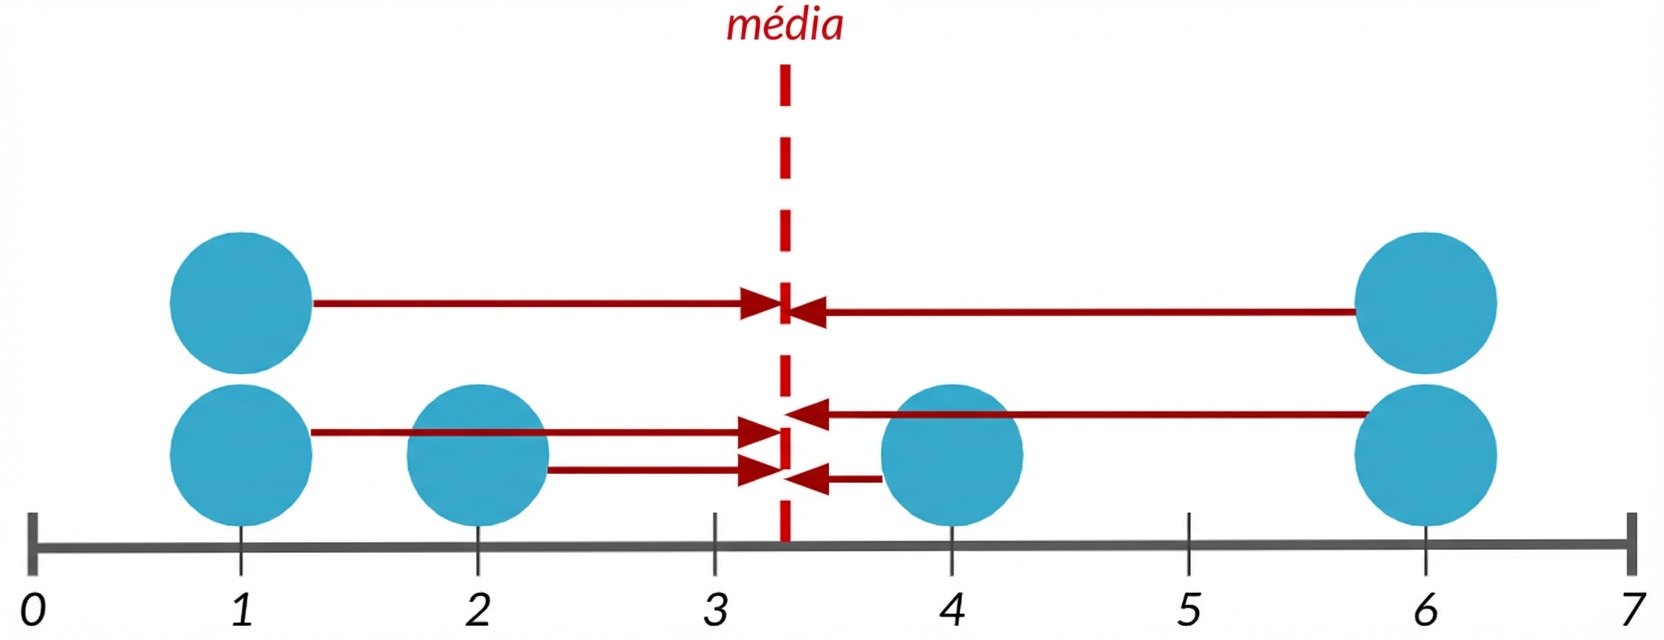
Variância
Distância média de cada ponto de dados para a média dos dados
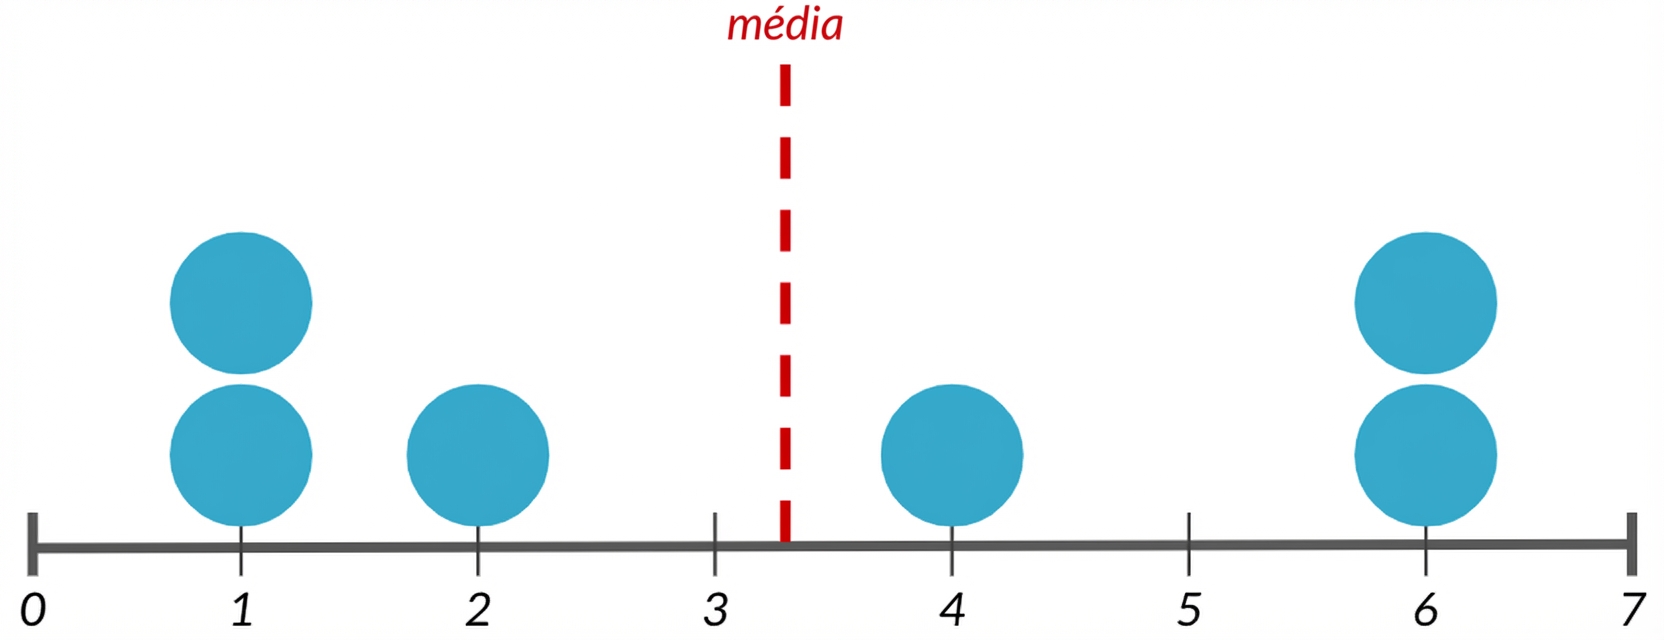
Variância
Distância média de cada ponto de dados para a média dos dados
 .
.
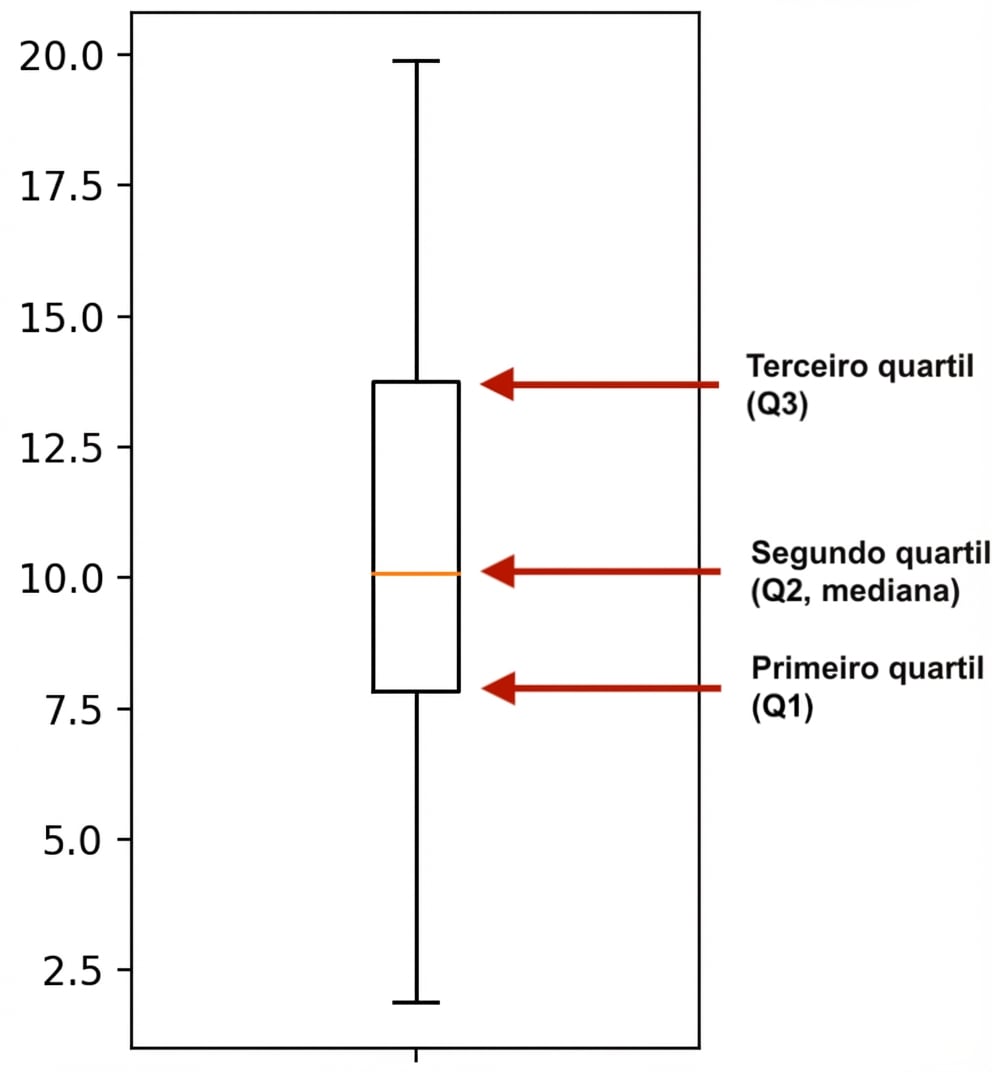
Boxplots usam quartis