Distribuições contínuas
Introdução à estatística em Python

Maggie Matsui
Content Developer, DataCamp
Esperando o ônibus
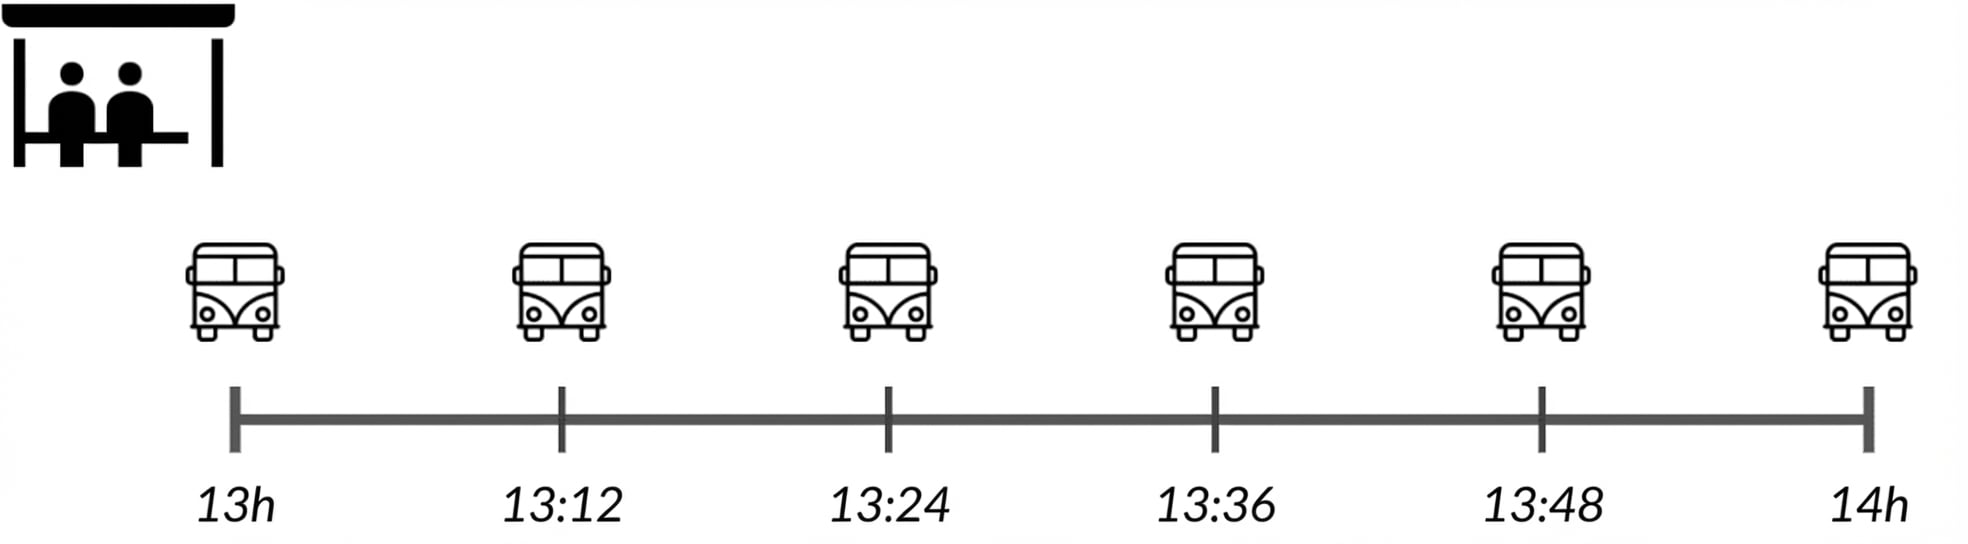
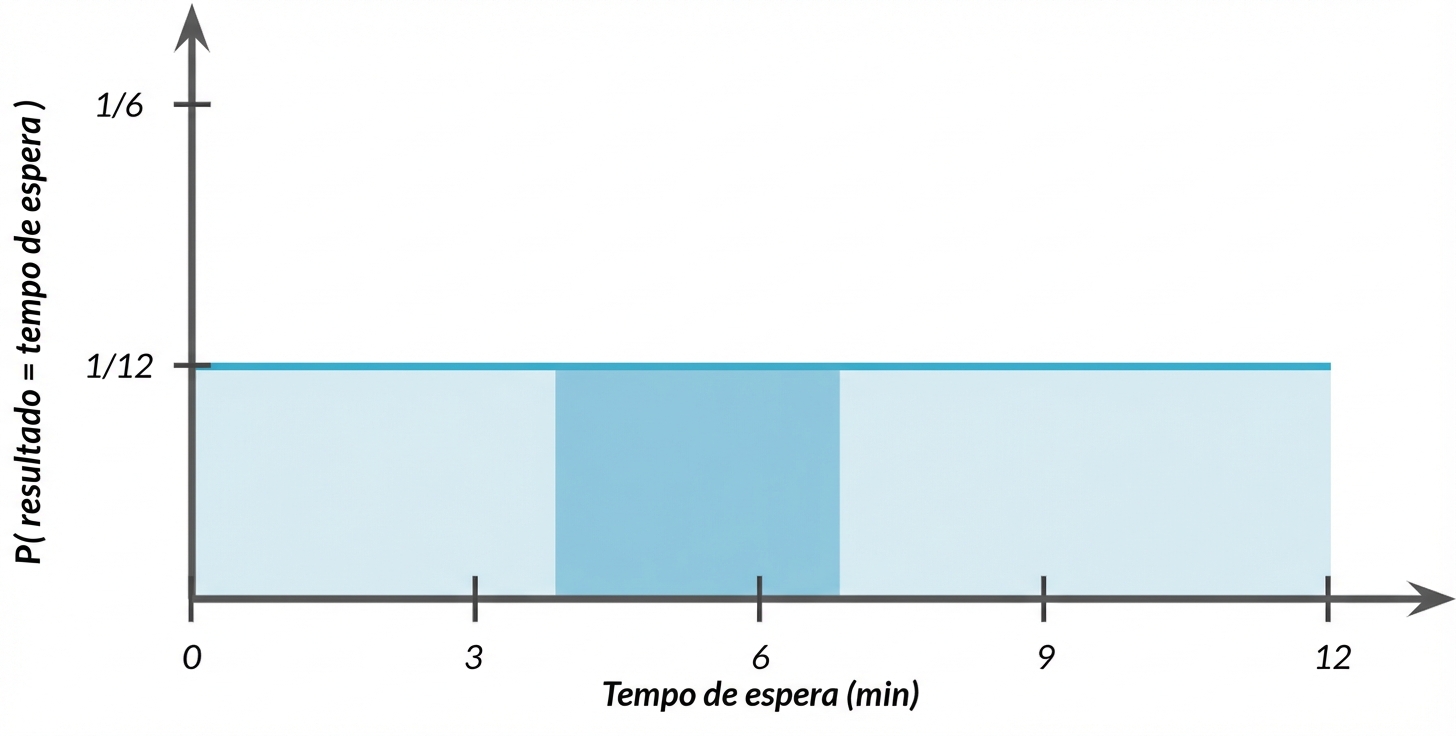
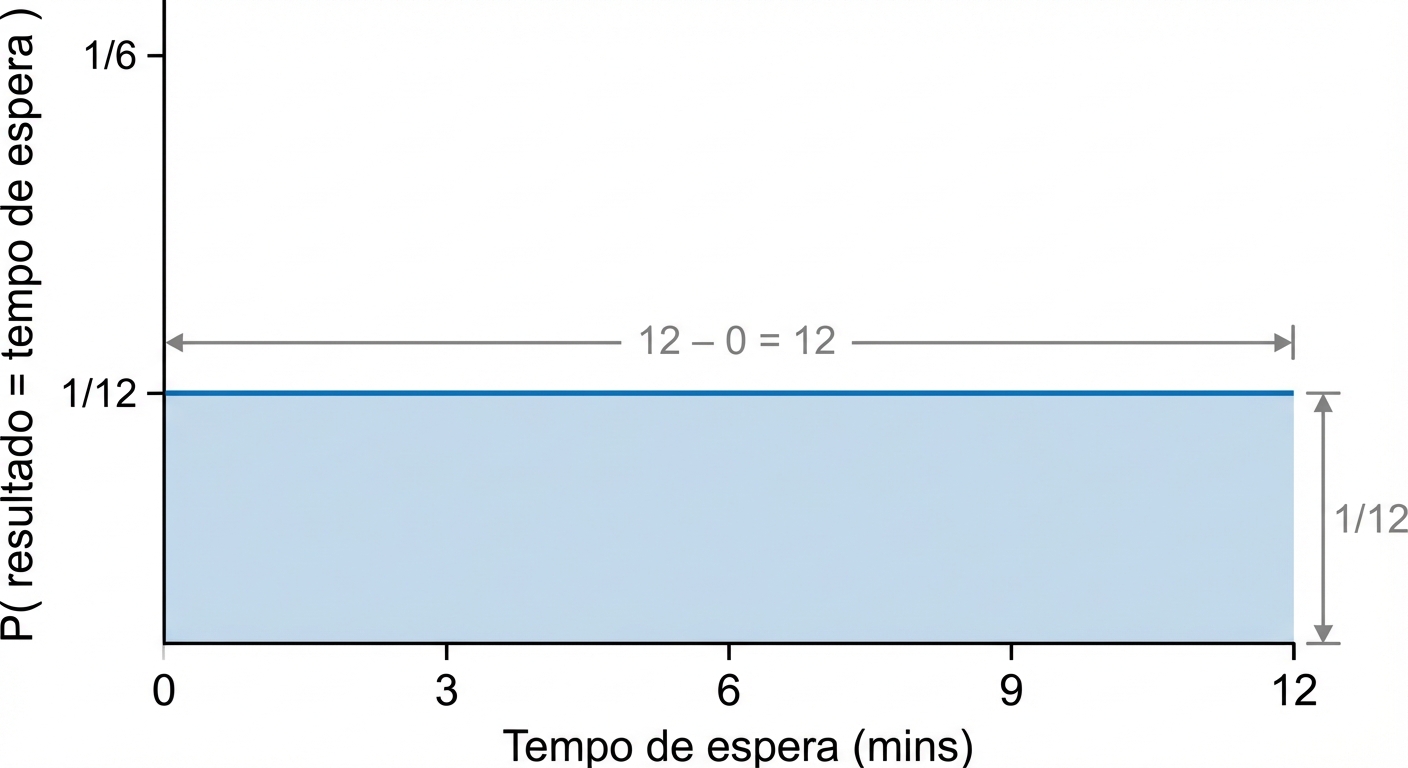
Distribuição uniforme contínua
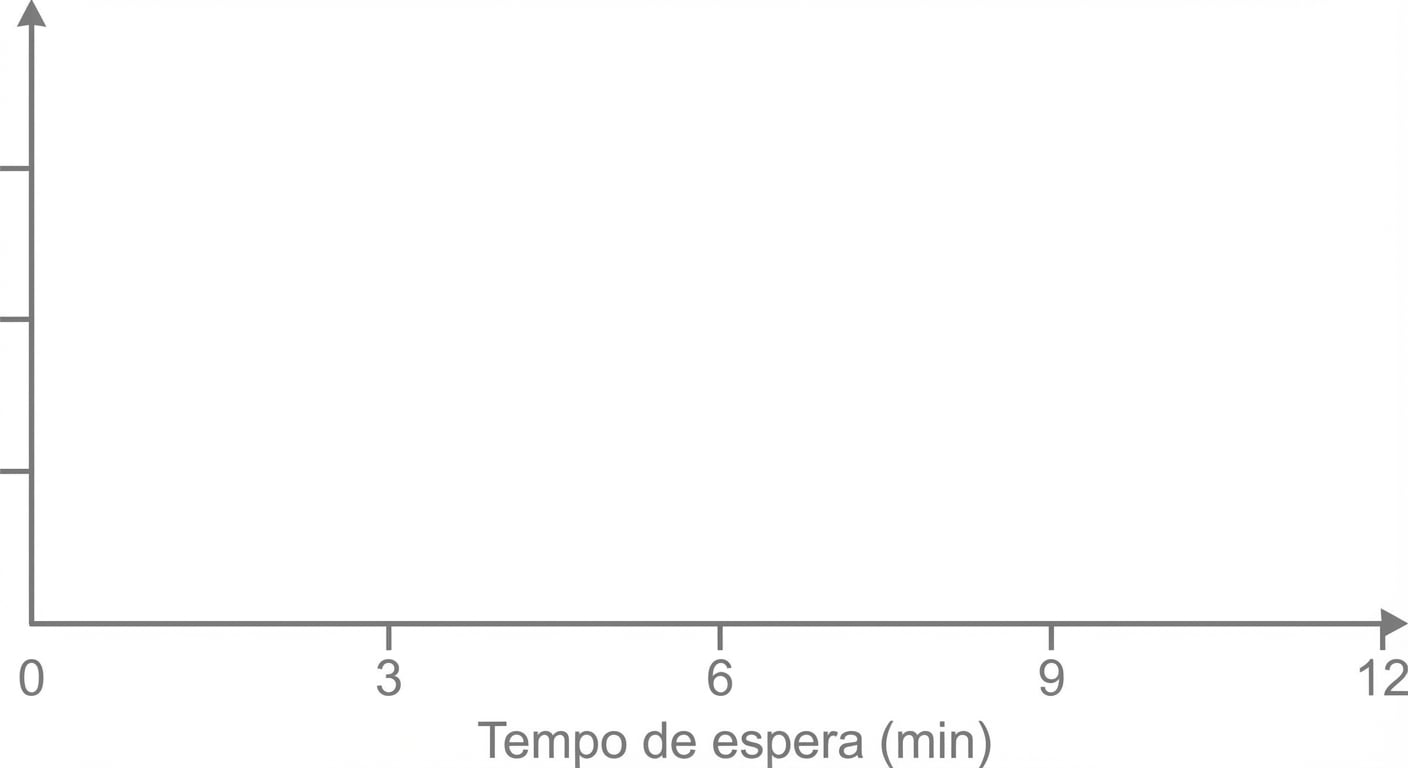
Distribuição uniforme contínua
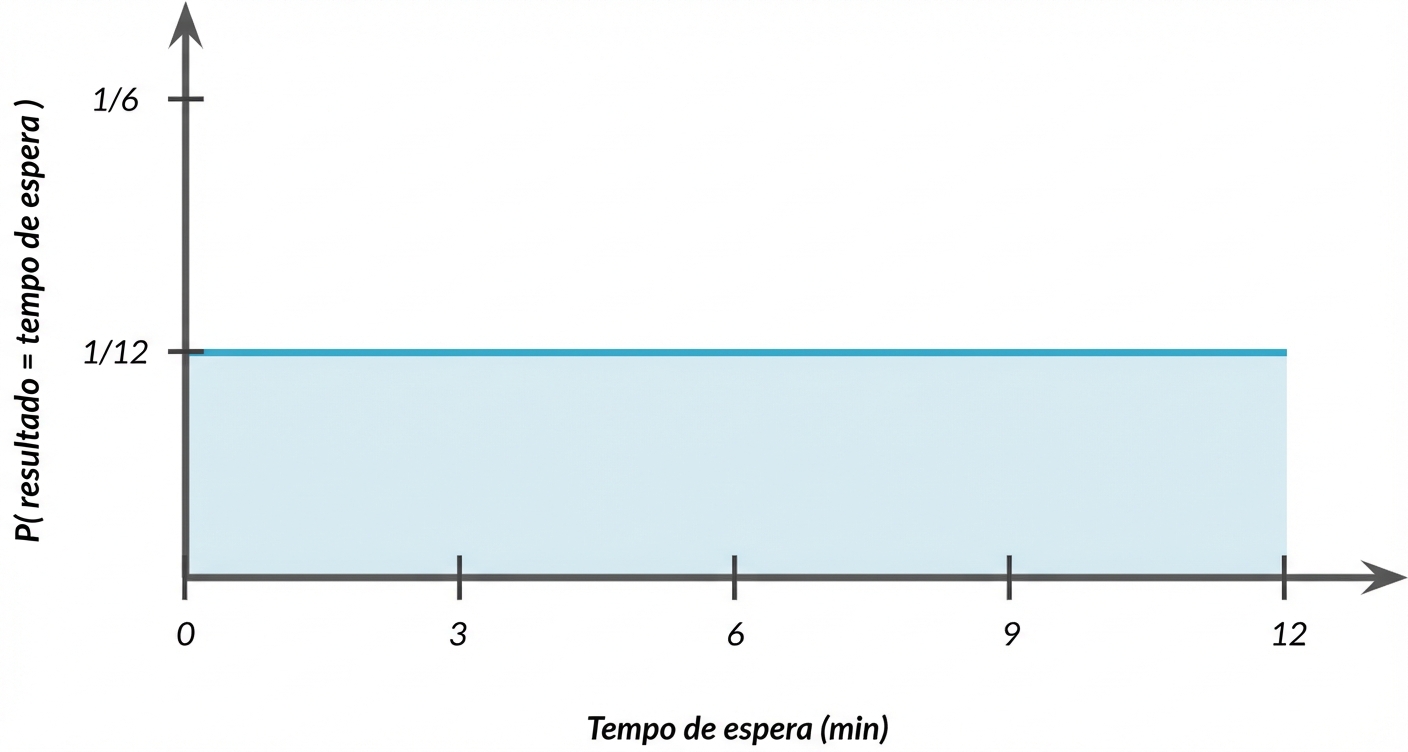
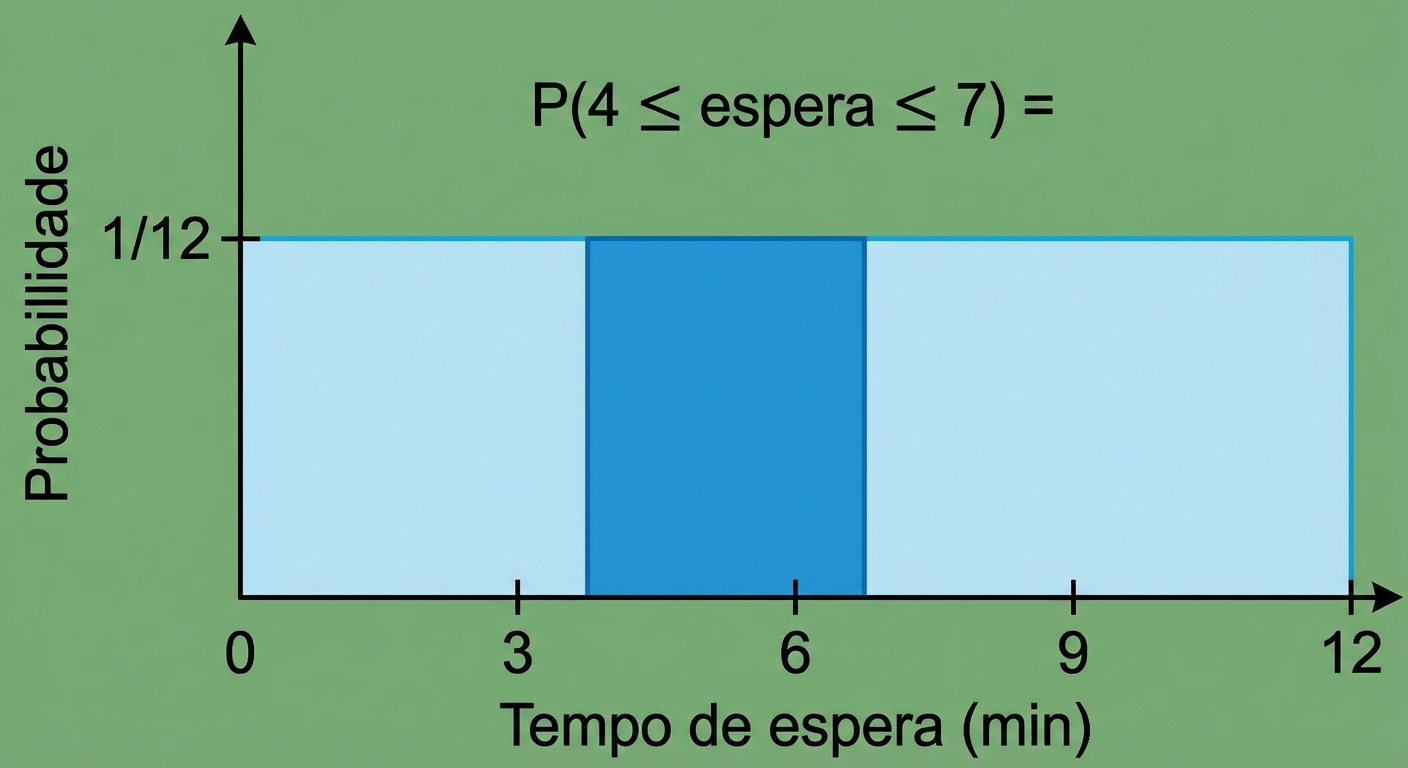
Probabilidade ainda = área
$$P(4 \le \text{wait time} \le 7) = ~~ ?$$
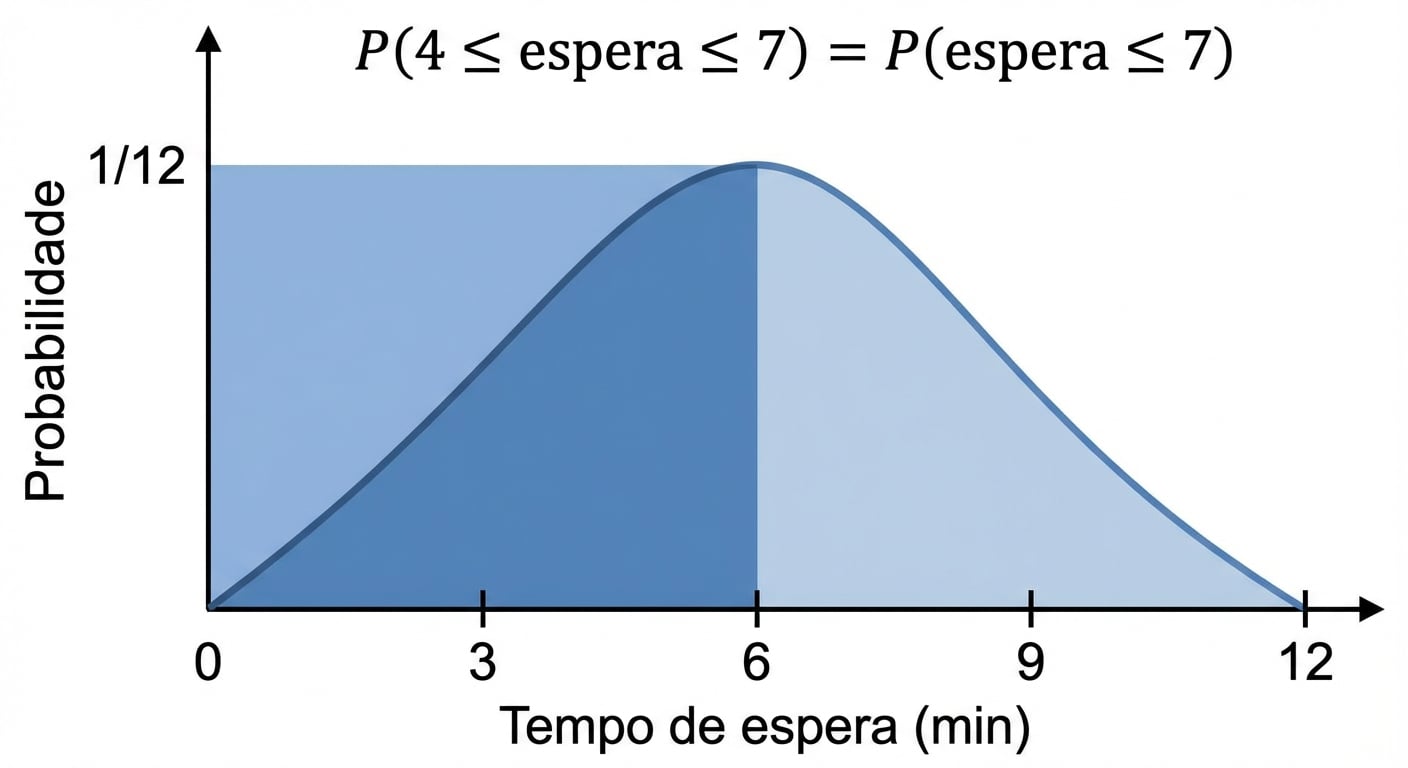
Probabilidade ainda = área
$$P(4 \le \text{wait time} \le 7) = ~~ ?$$
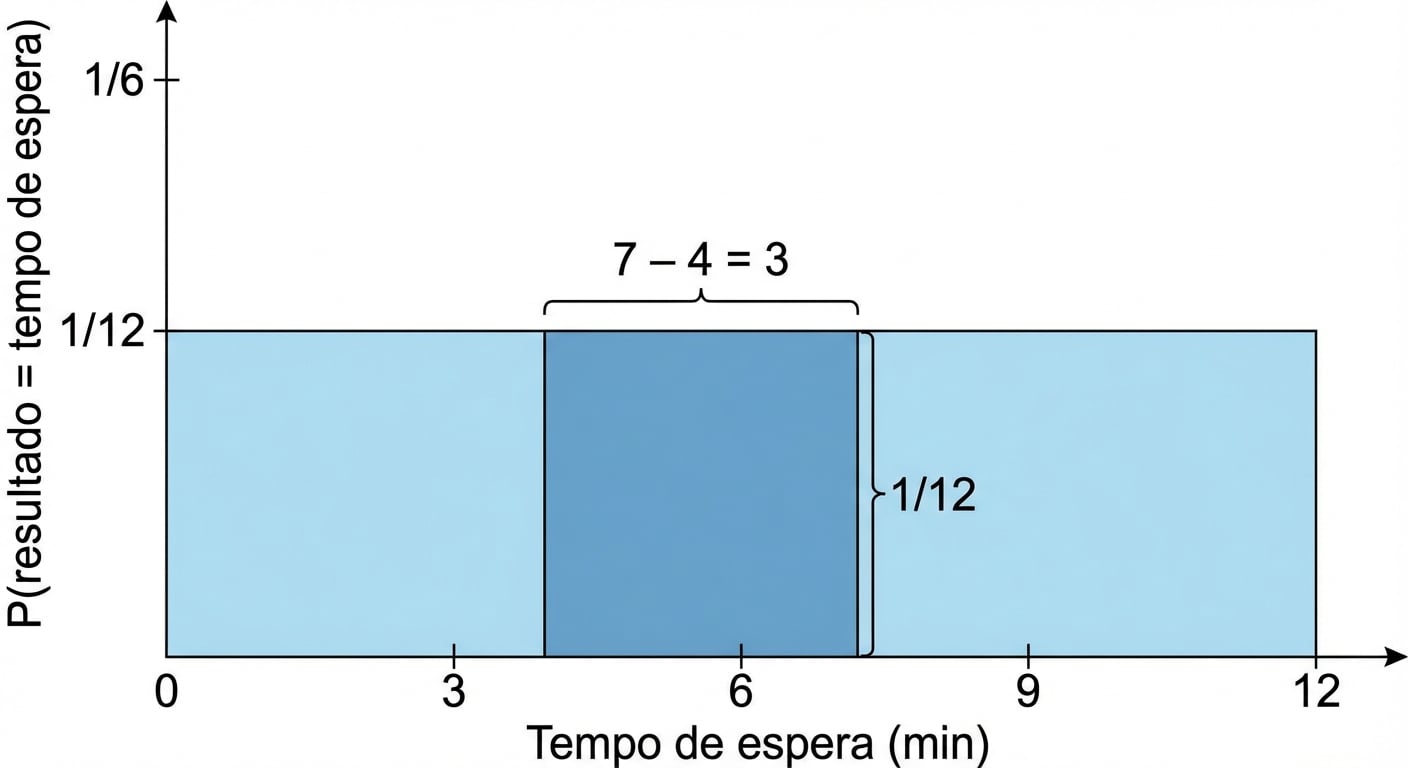
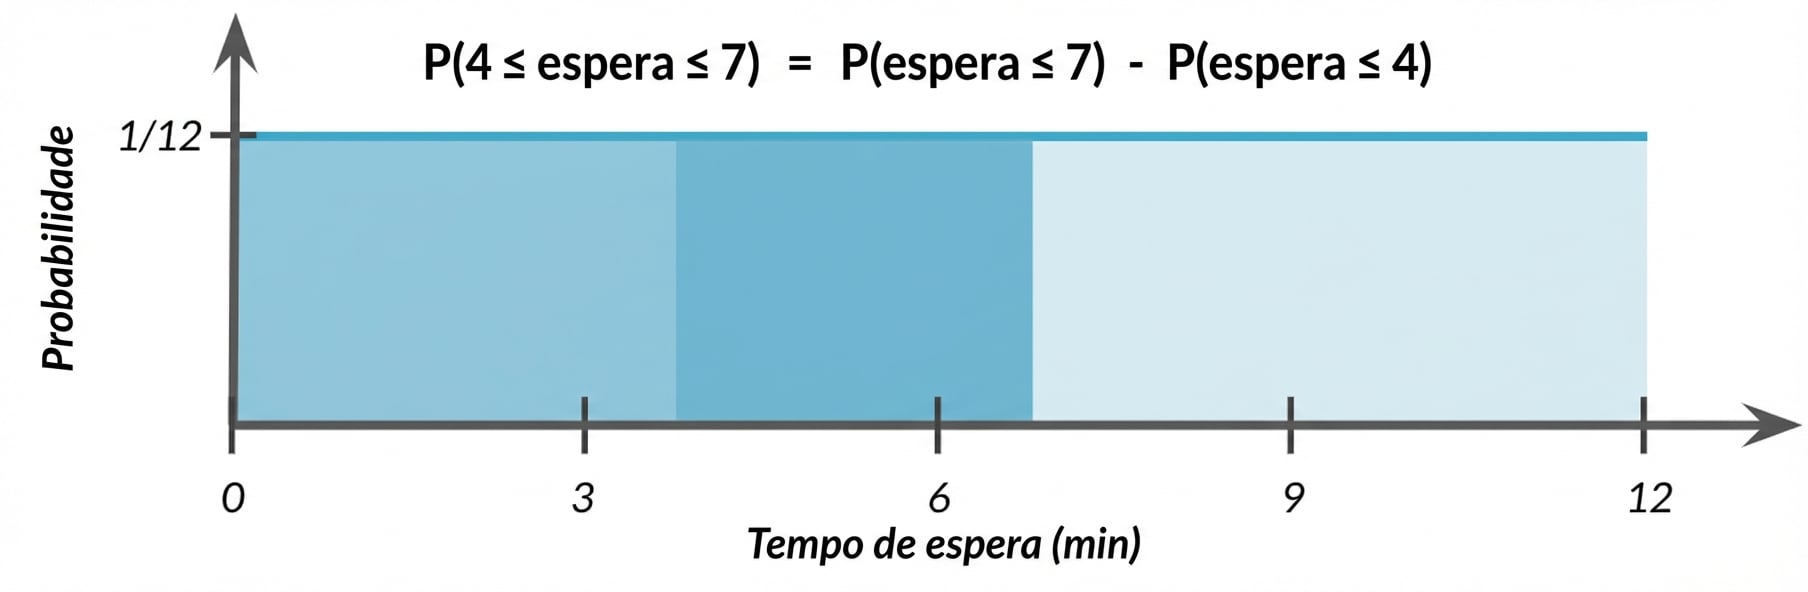
Probabilidade ainda = área
$$P(4 \le \text{wait time} \le 7) = 3 \times 1/12 = 3/12$$
Distribuição uniforme em Python
$$ P(\text{wait time} \le 7)$$
from scipy.stats import uniformuniform.cdf(7, 0, 12)
0.5833333
Probabilidades "maiores que"
$$ P(\text{wait time} \ge 7) = 1 - P(\text{wait time} \le 7)$$
from scipy.stats import uniform
1 - uniform.cdf(7, 0, 12)
0.4166667
$$ P(4 \le \text{wait time} \le 7)$$
$$ P(4 \le \text{wait time} \le 7)$$
$$ P(4 \le \text{wait time} \le 7)$$
from scipy.stats import uniform

uniform.cdf(7, 0, 12) - uniform.cdf(4, 0, 12)
0.25
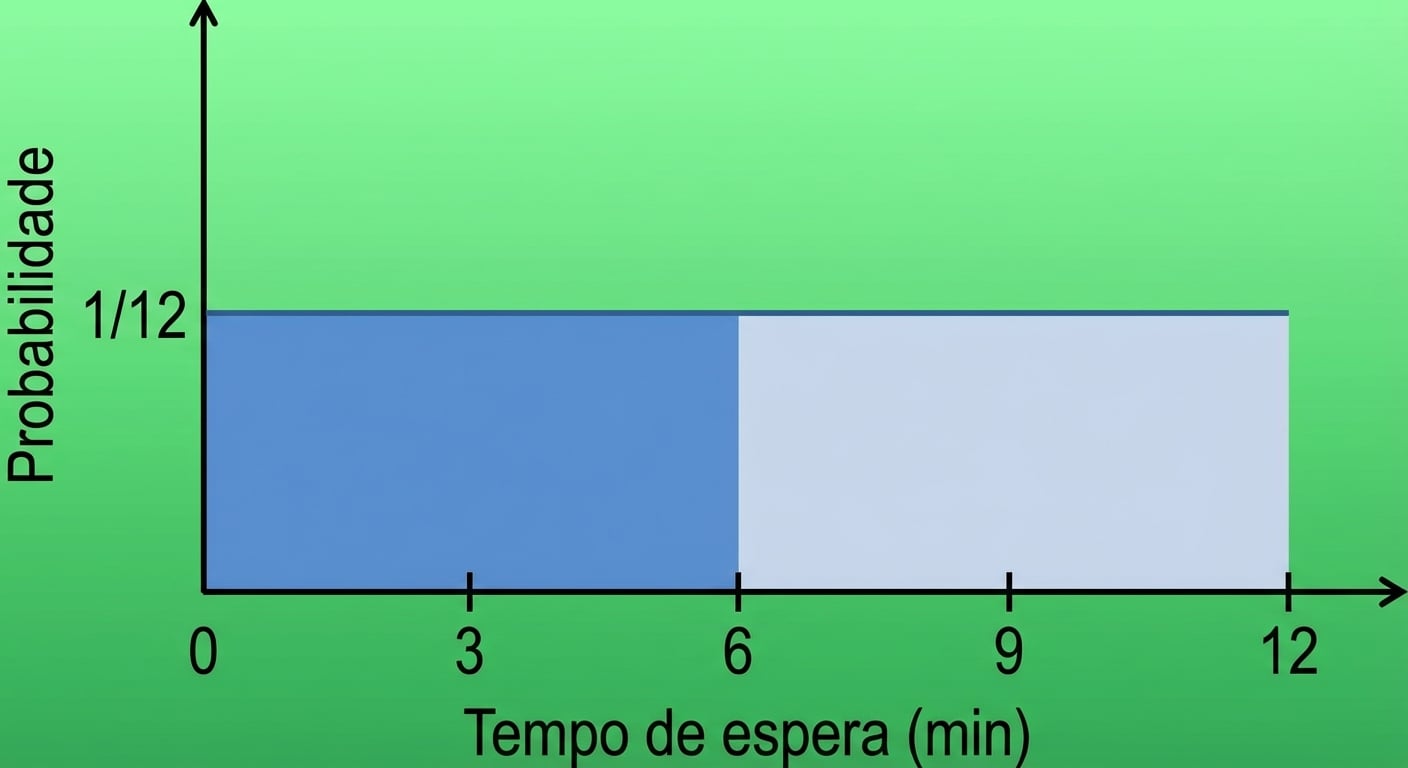
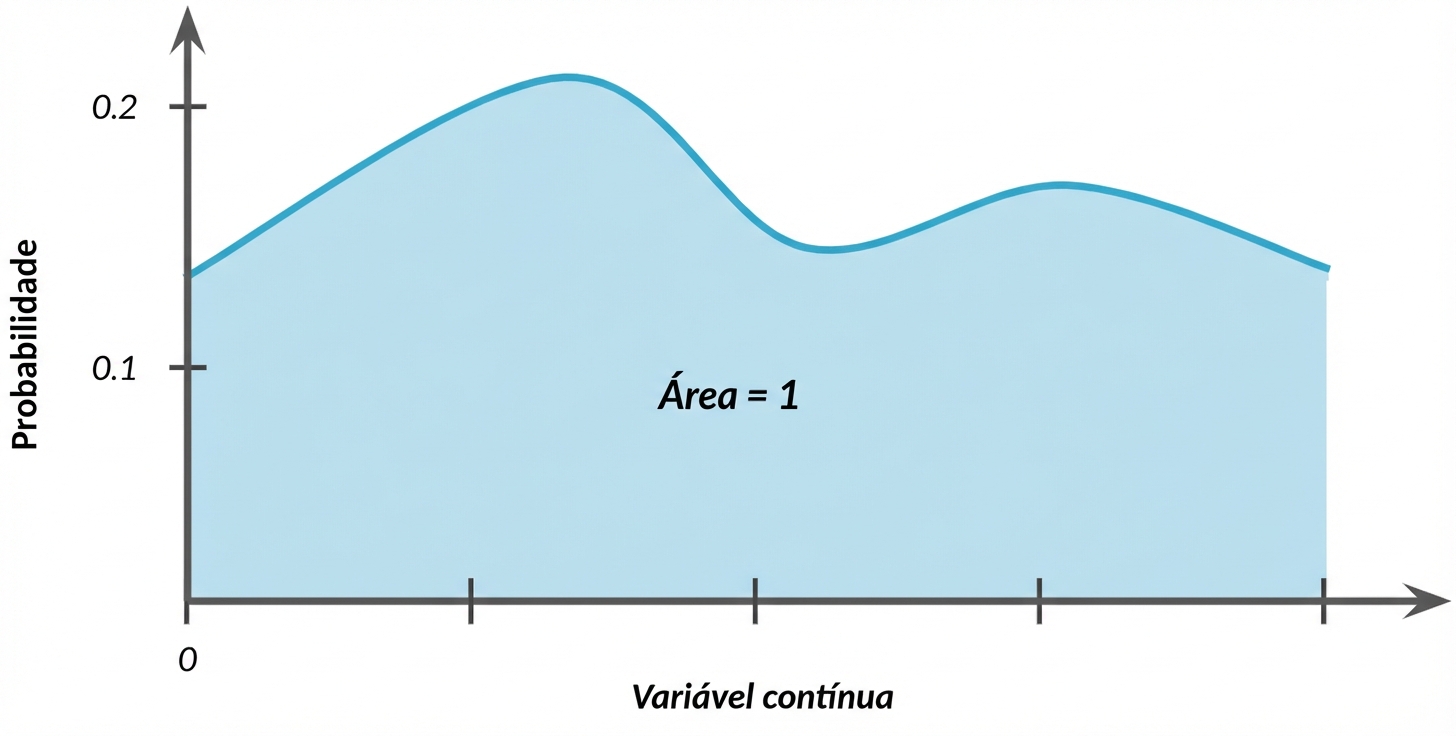
Área total = 1
$$P(0 \le \text{wait time} \le 12) = ~~ ?$$
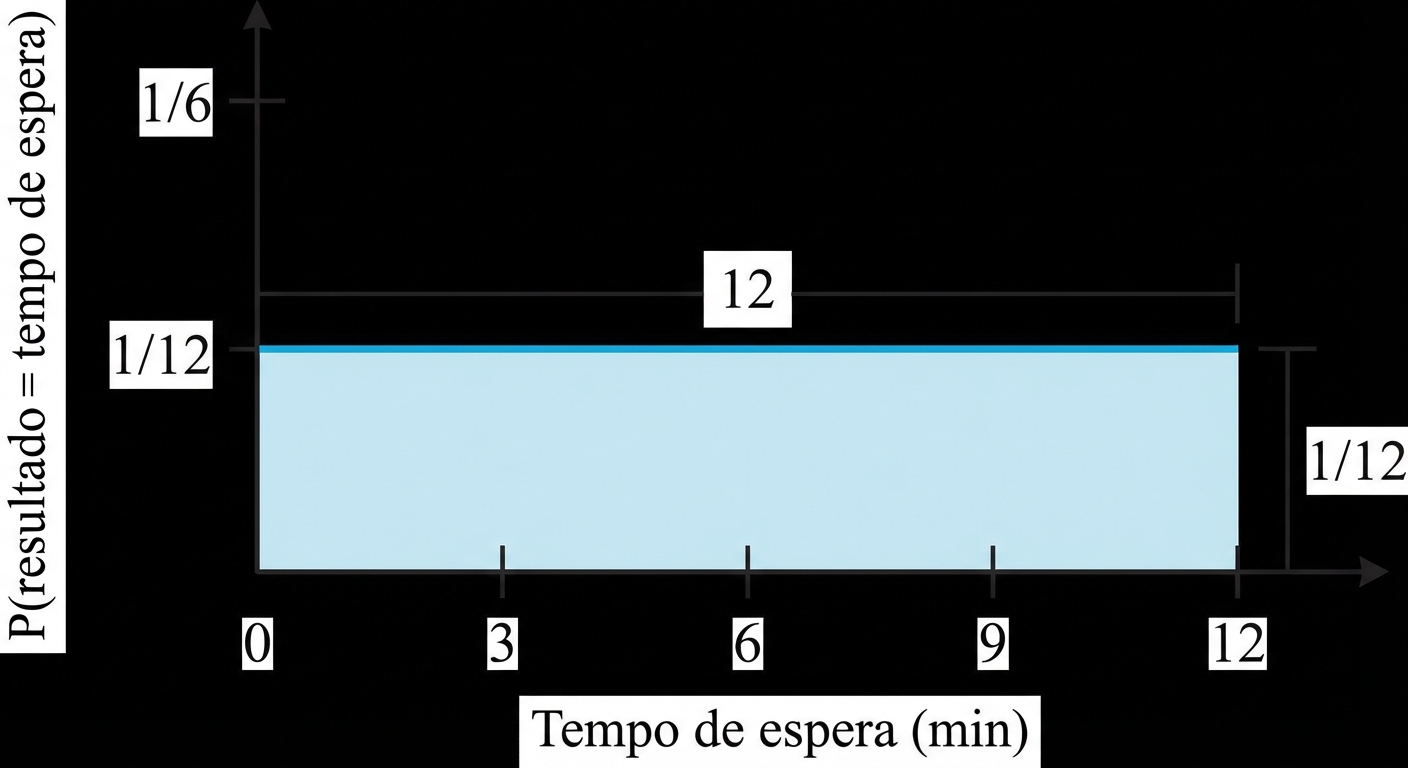
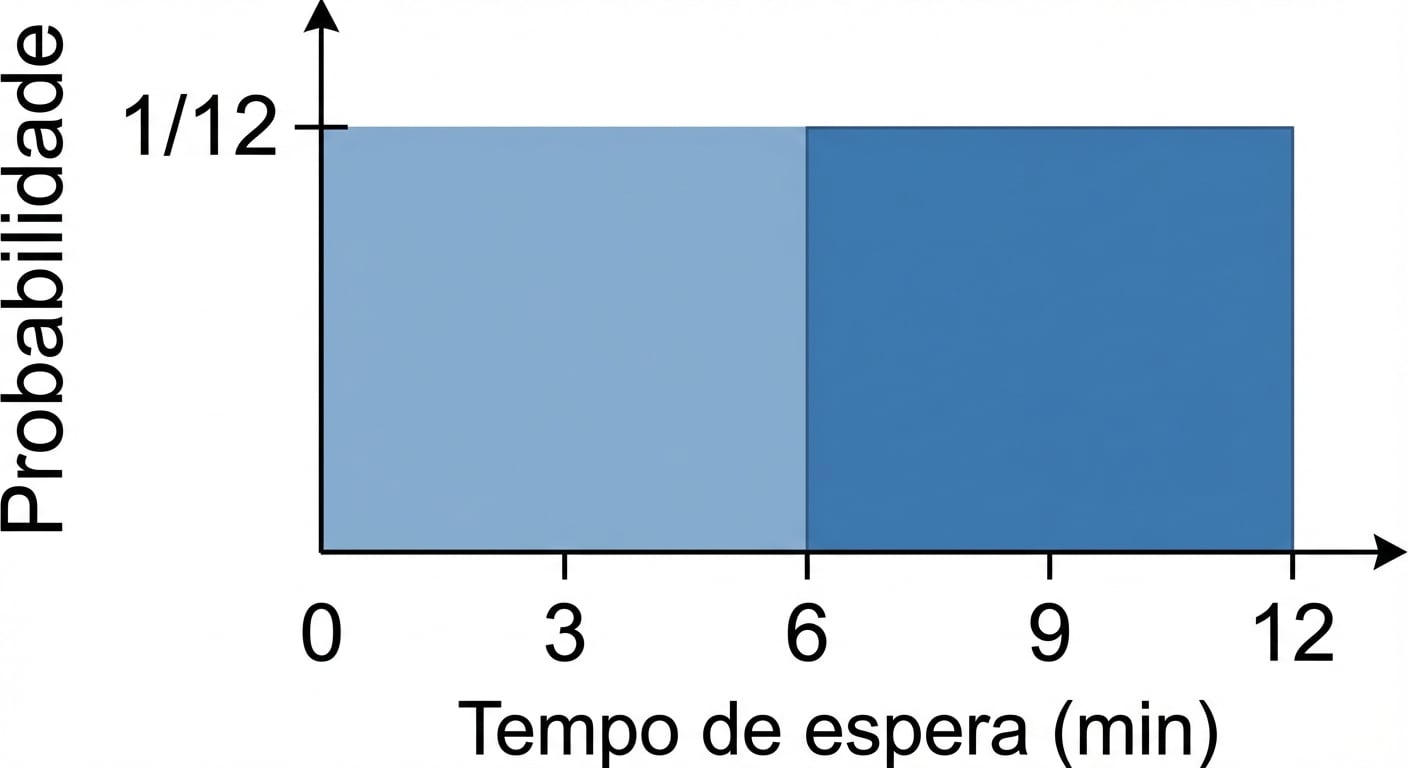
Área total = 1
$$P(0 \le \text{outcome} \le 12) = 12 \times 1/12 = 1$$
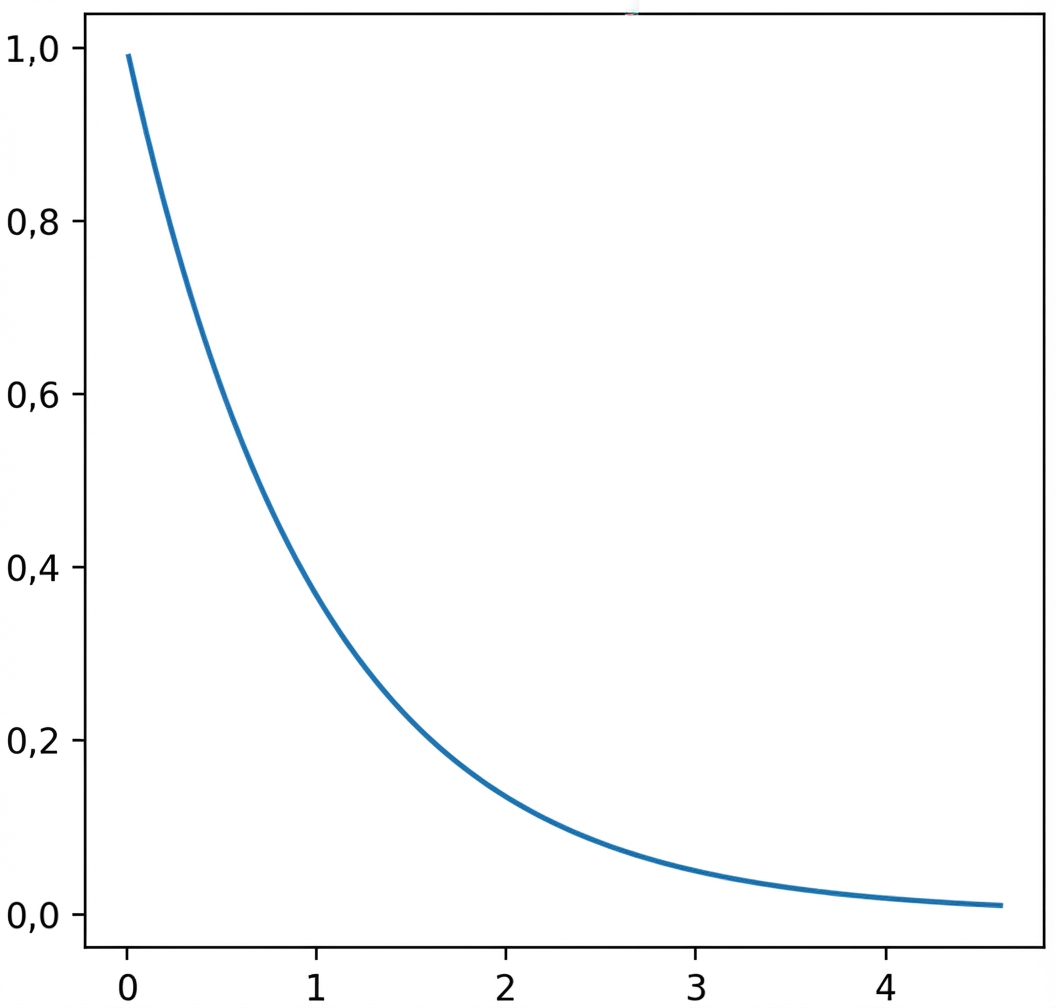
Outras distribuições contínuas
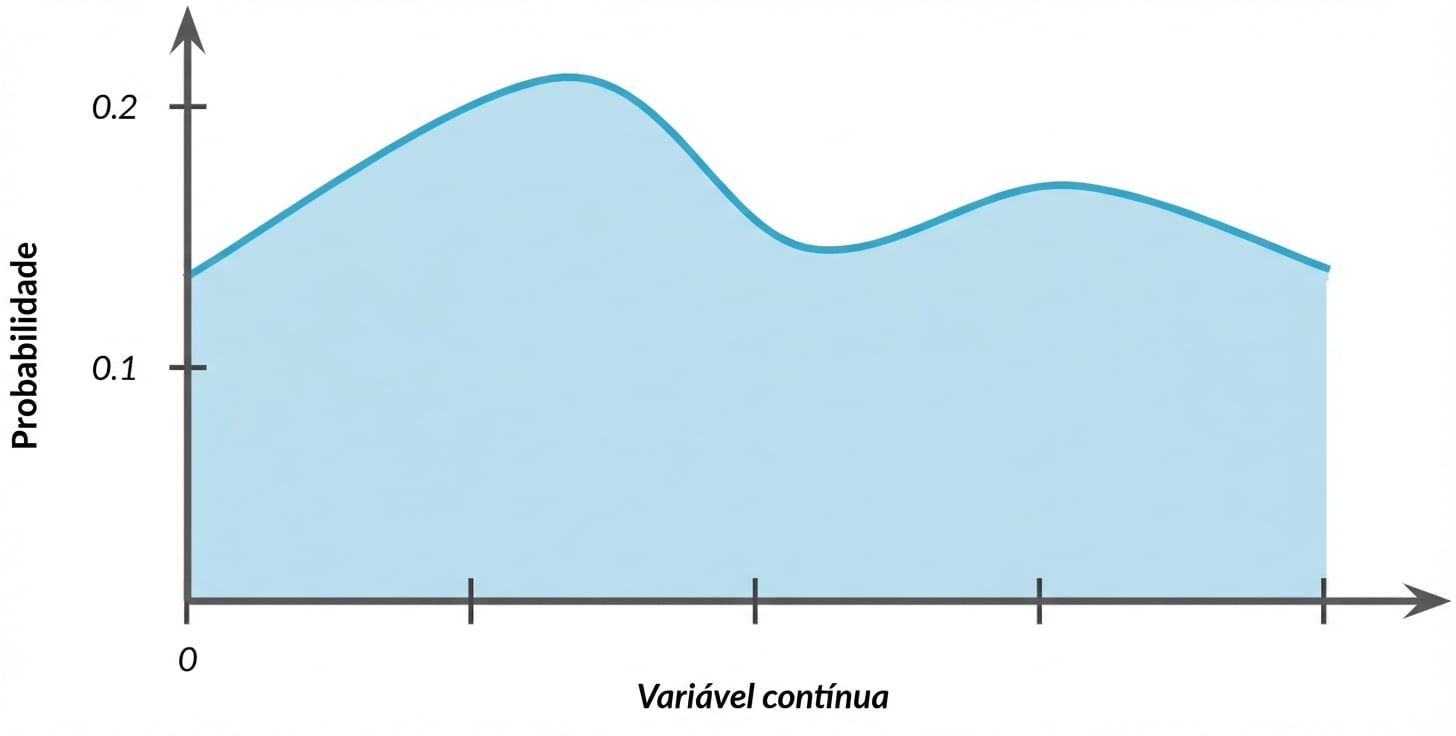
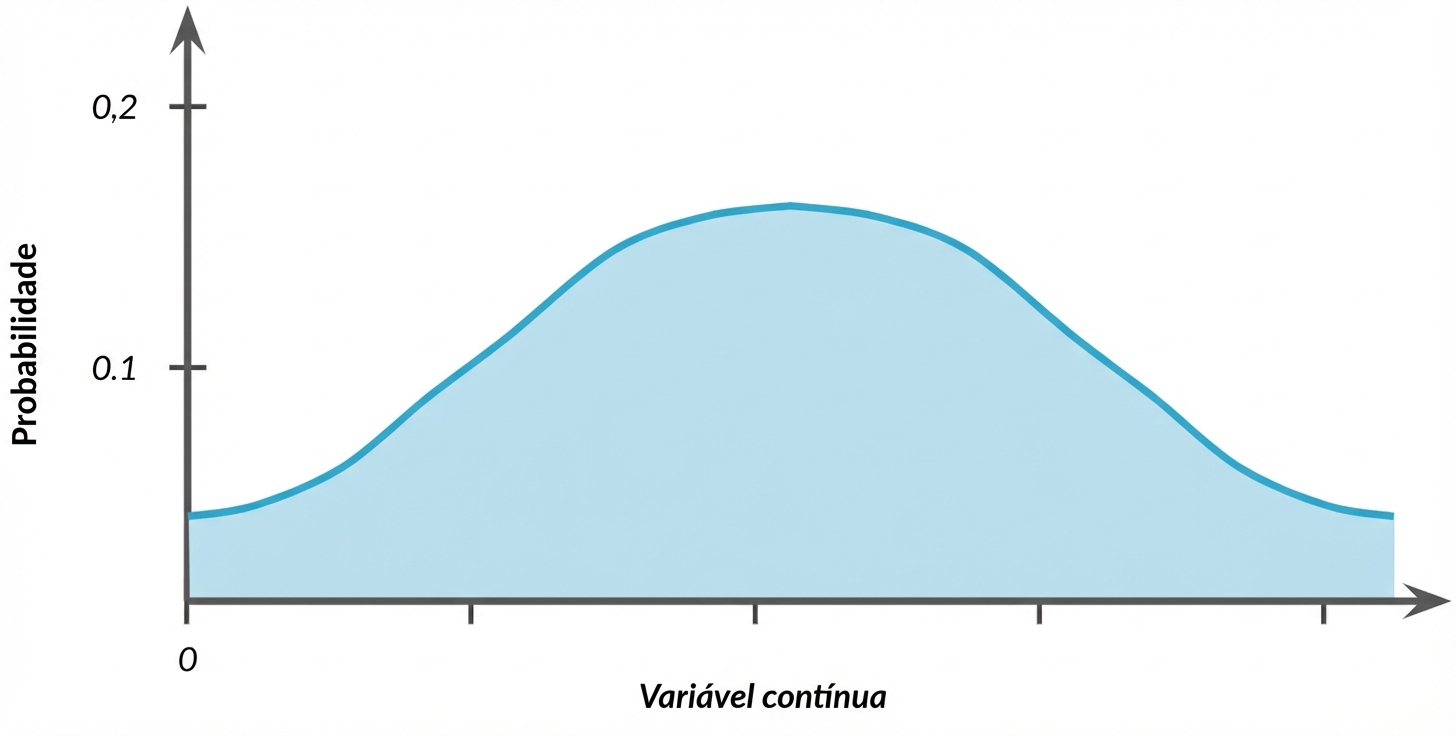
Outras distribuições contínuas
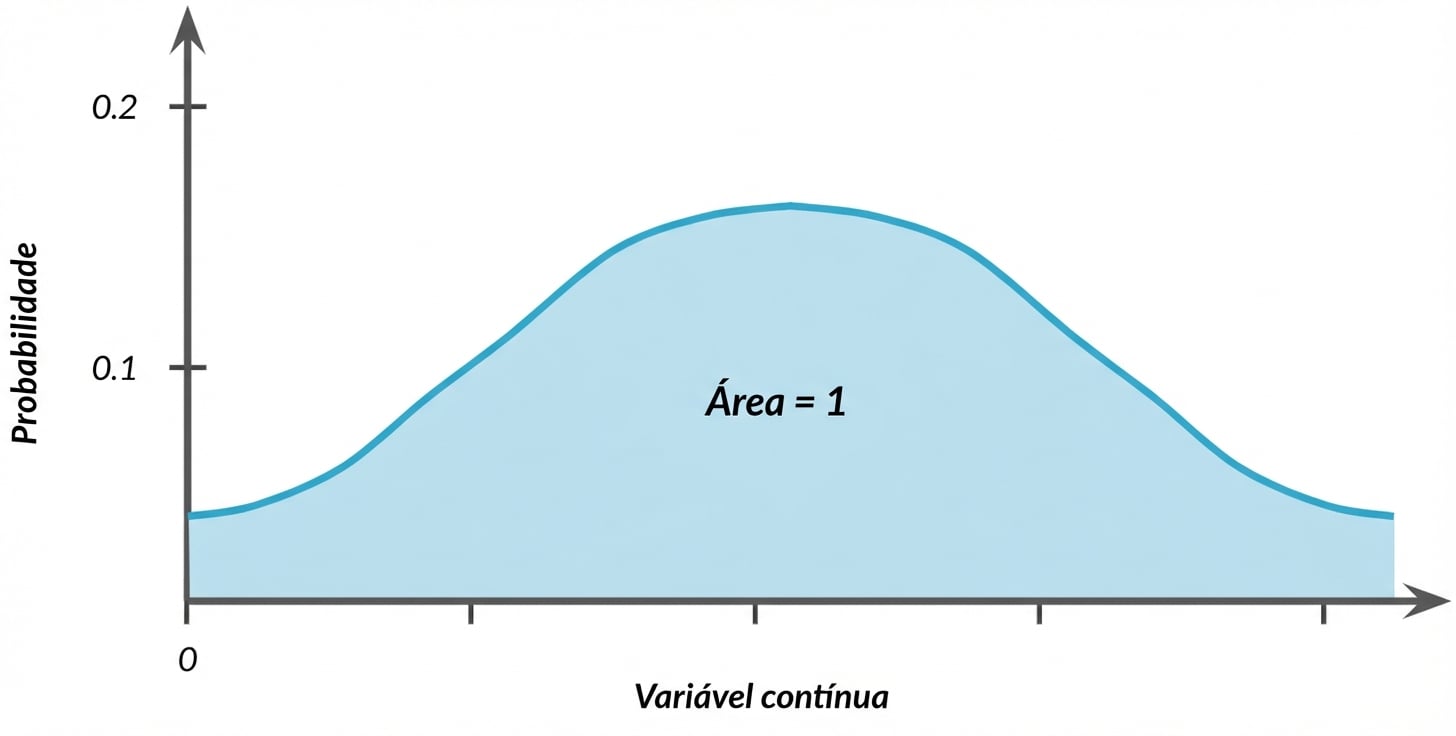
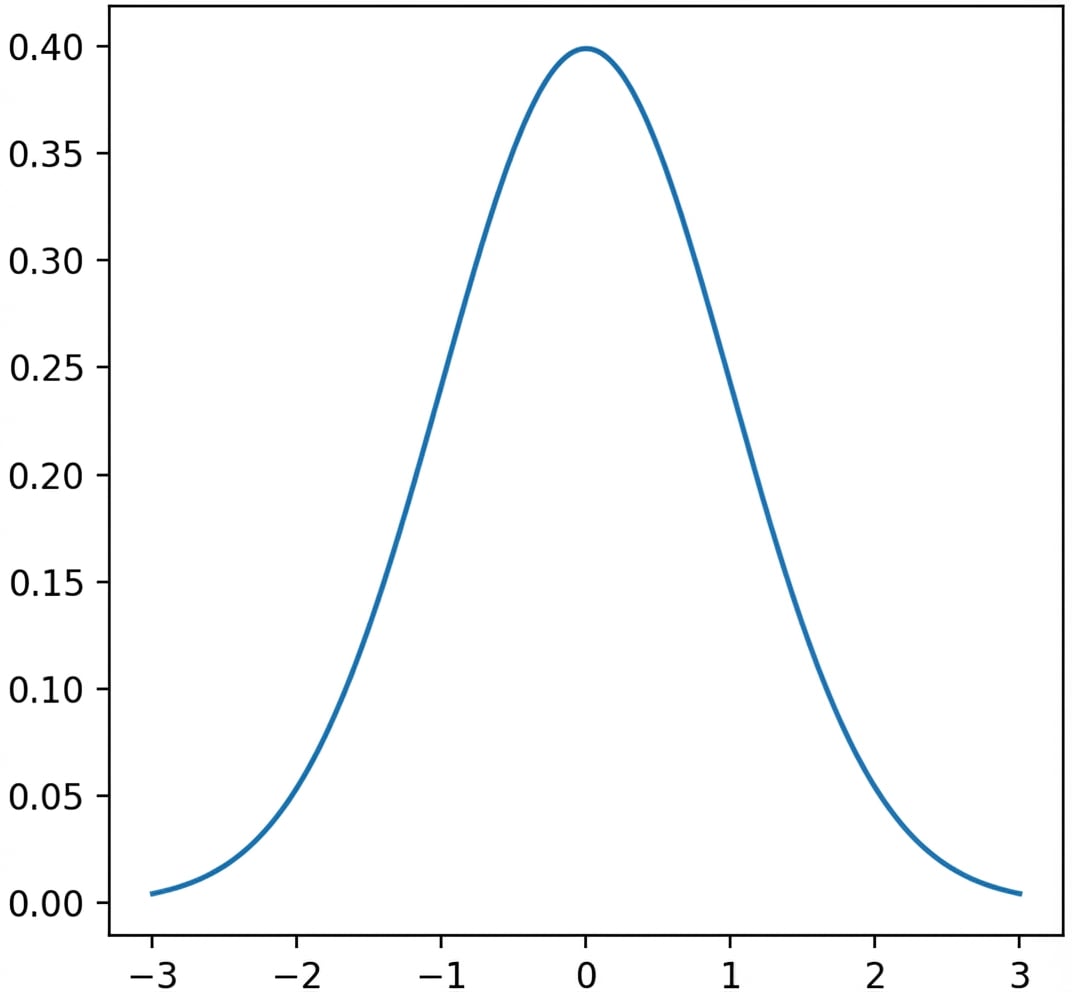
Outros tipos especiais de distribuições
Distribuição normal
Distribuição exponencial