Correlation
Introdução à estatística

George Boorman
Curriculum Manager, DataCamp
Relationships between two variables
Linear relationships
- Linear = proportionate changes between dependent and independent variables
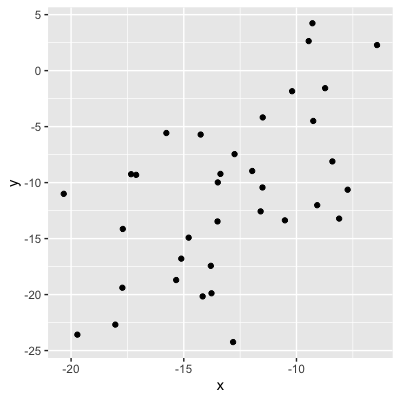
Values = strength of the relationship
0.99 (very strong relationship)
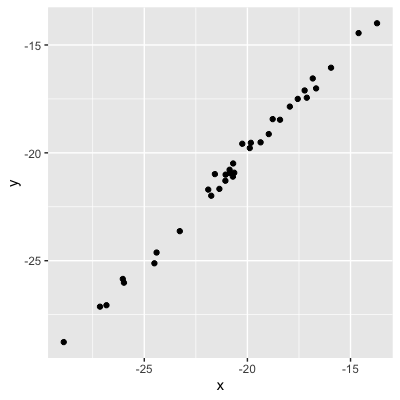
Values = strength of the relationship
0.99 (very strong relationship)
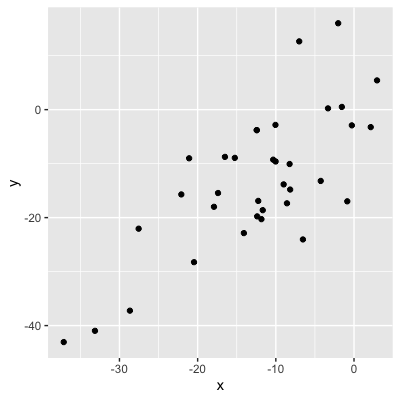
0.75 (strong relationship)
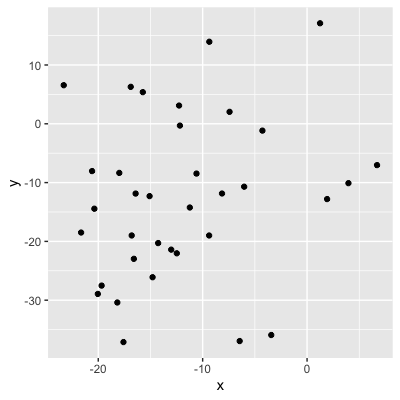
Values = strength of the relationship
0.56 (moderate relationship)
Values = strength of the relationship
0.56 (moderate relationship)
0.21 (weak relationship)
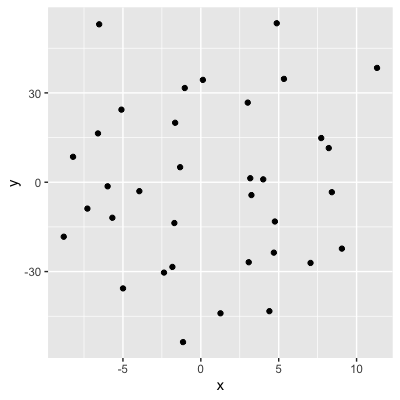
Values = strength of the relationship
0.04 (no relationship)
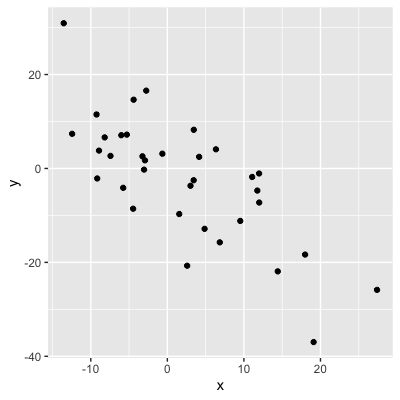
Sign = direction
0.75: as x increases, y increases
-0.75: as x increases, y decreases
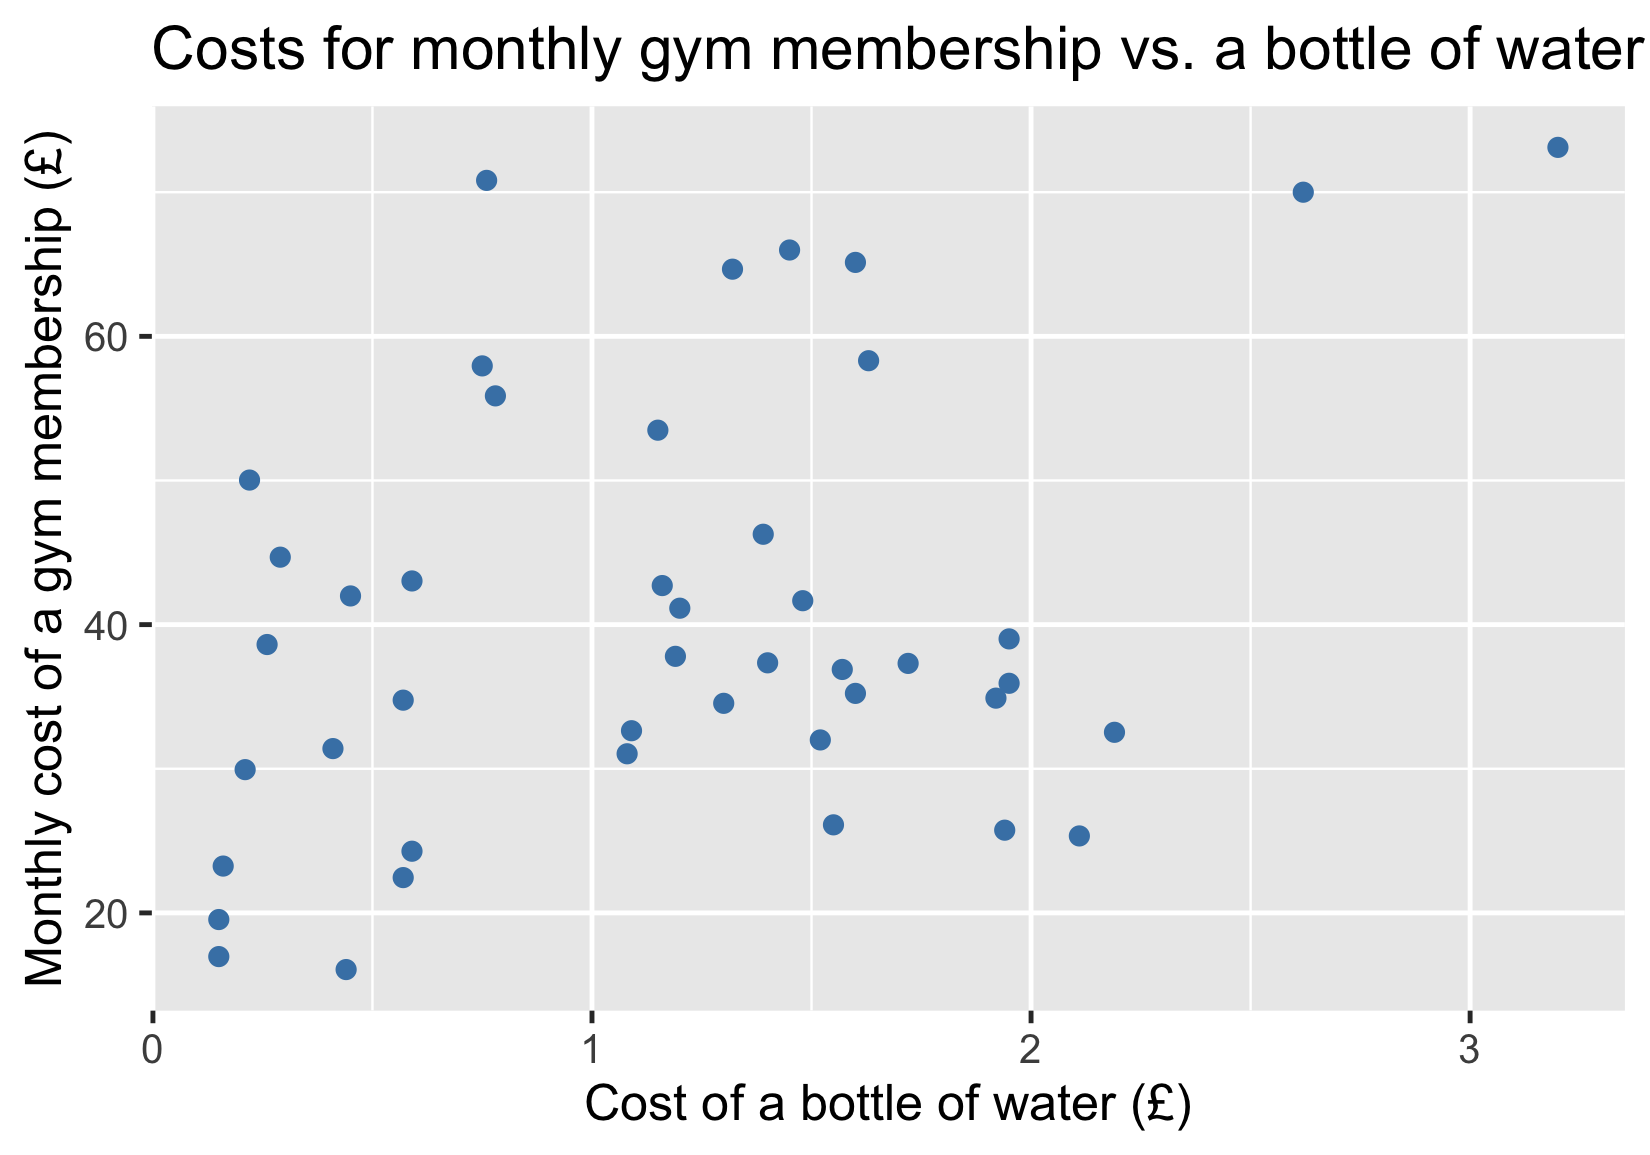
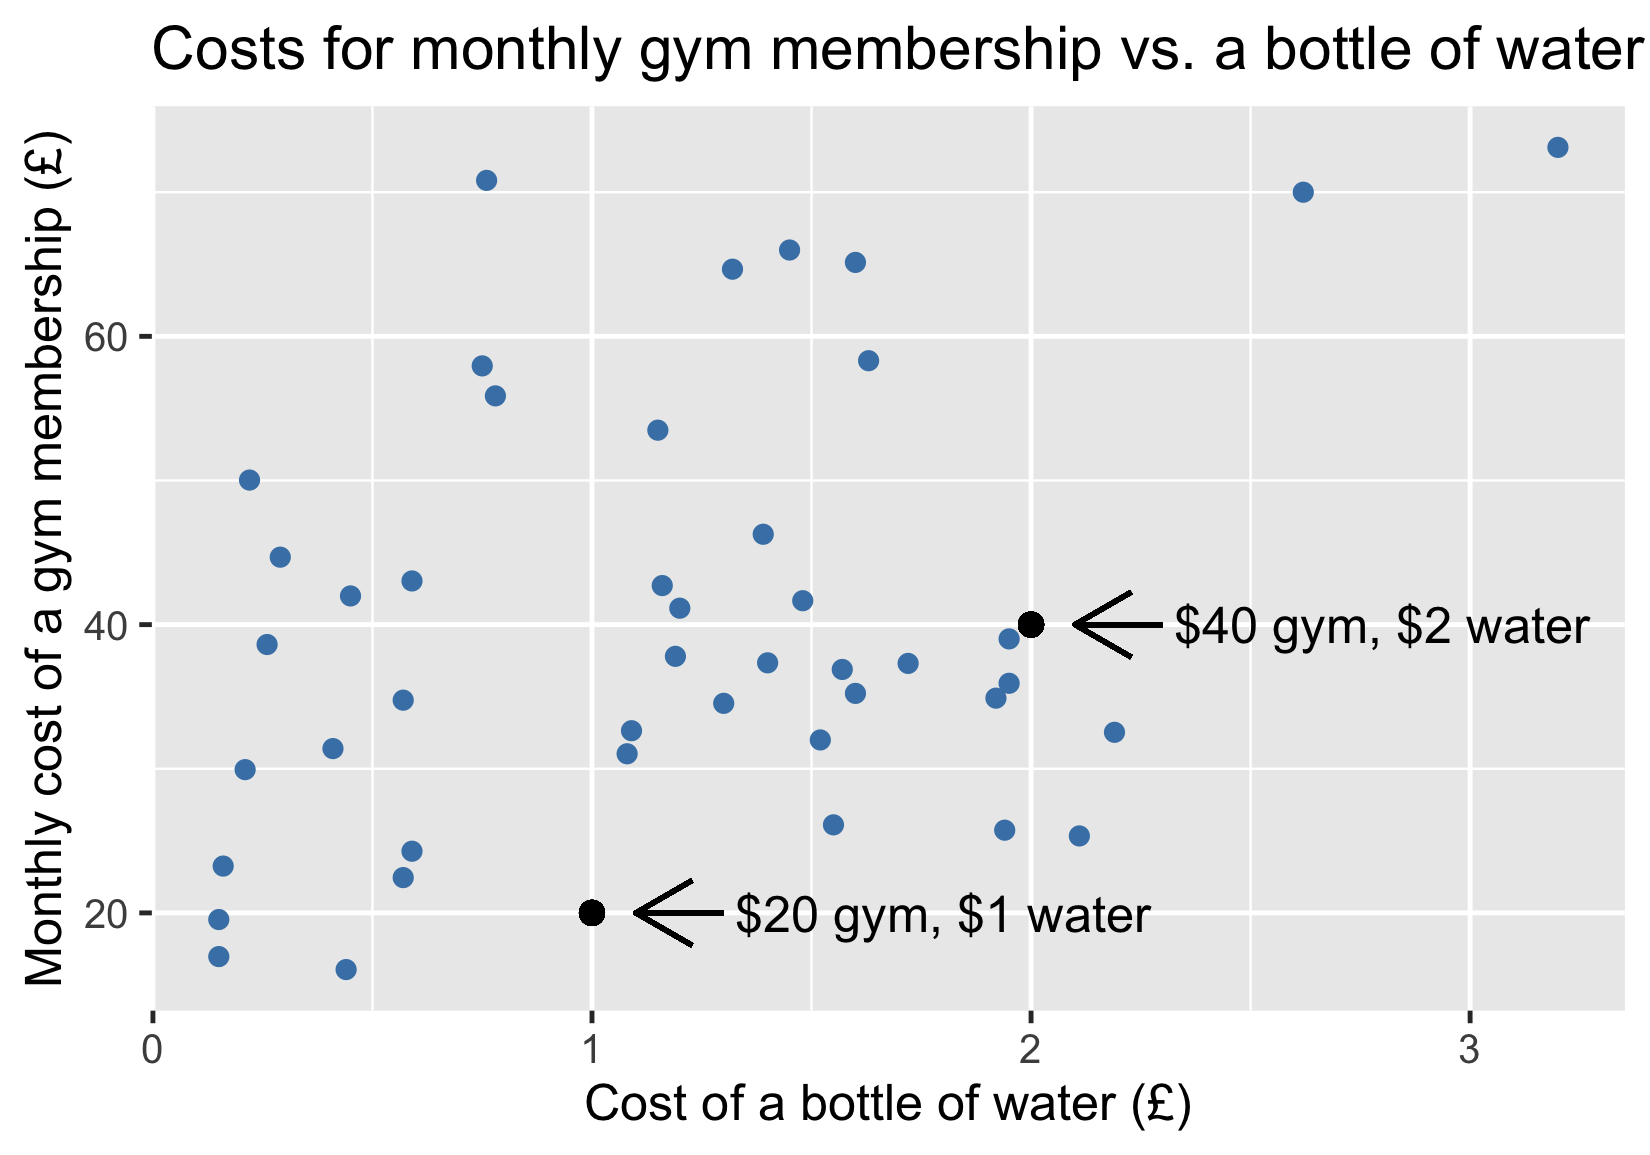
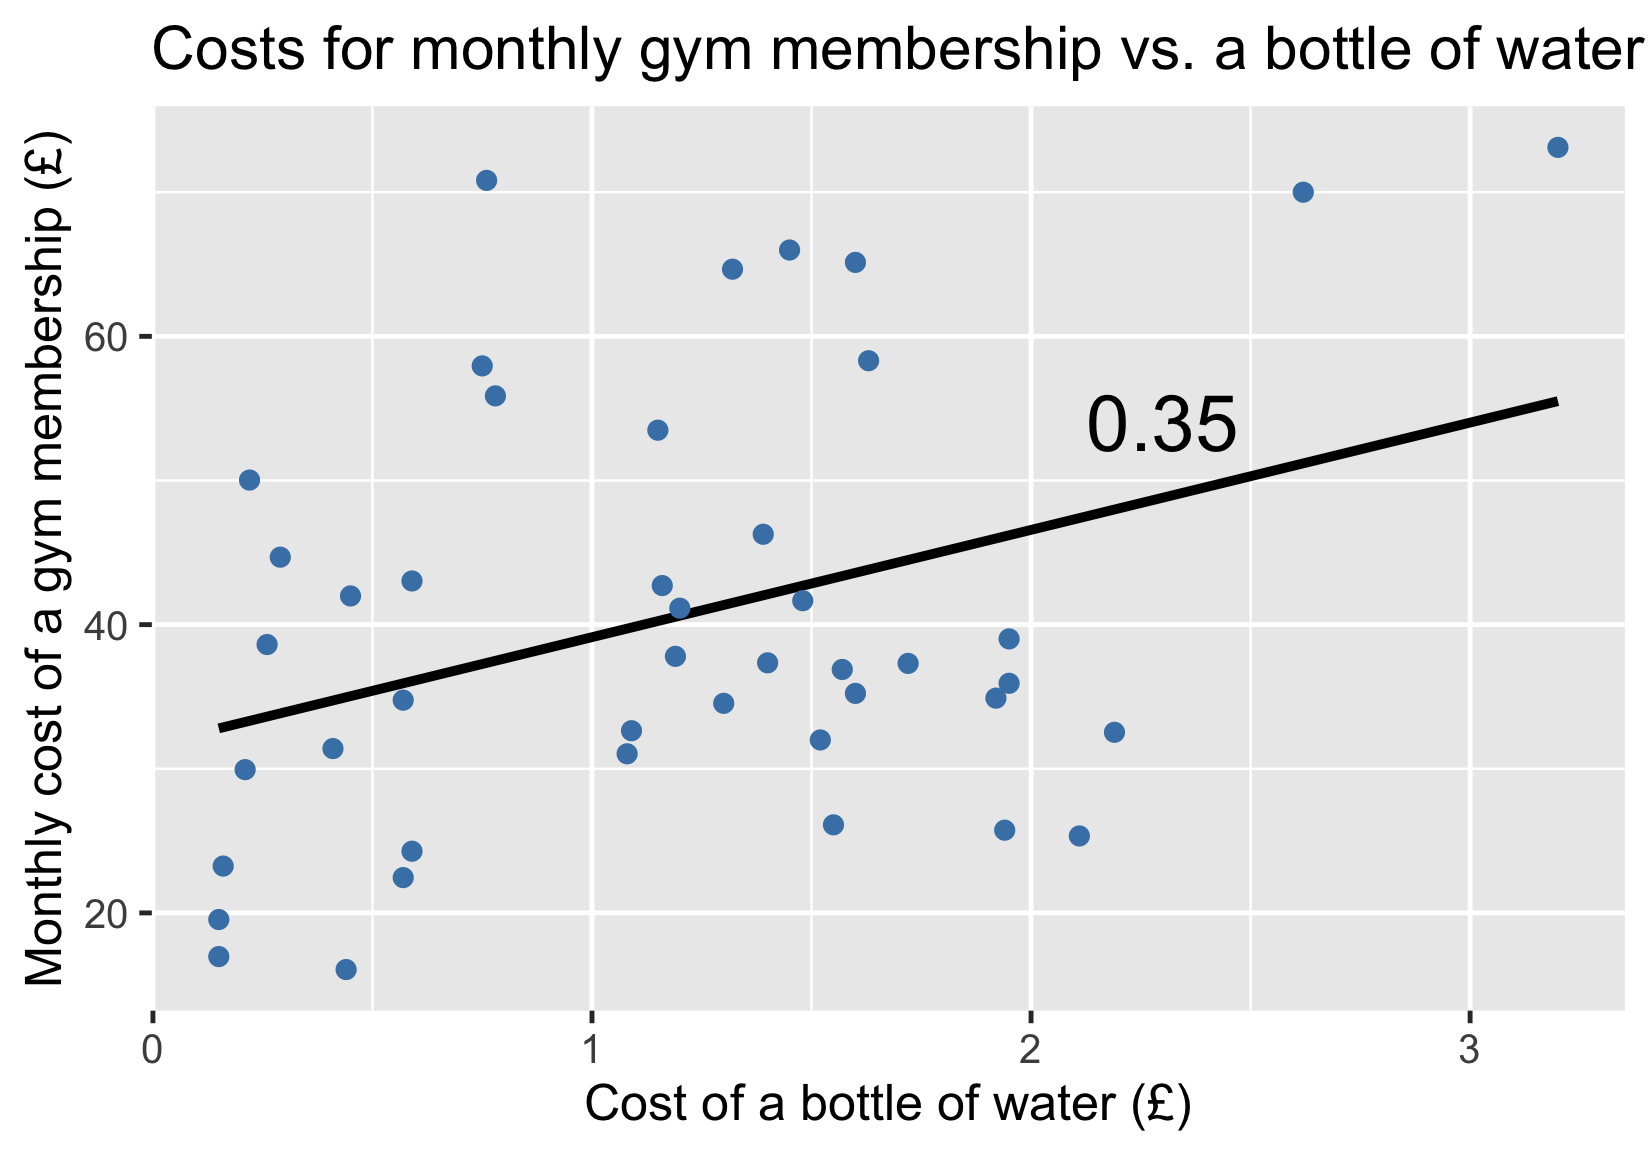
Gym costs vs. water costs
Adding a trendline
Life expectancy vs. cost of a bottle of water
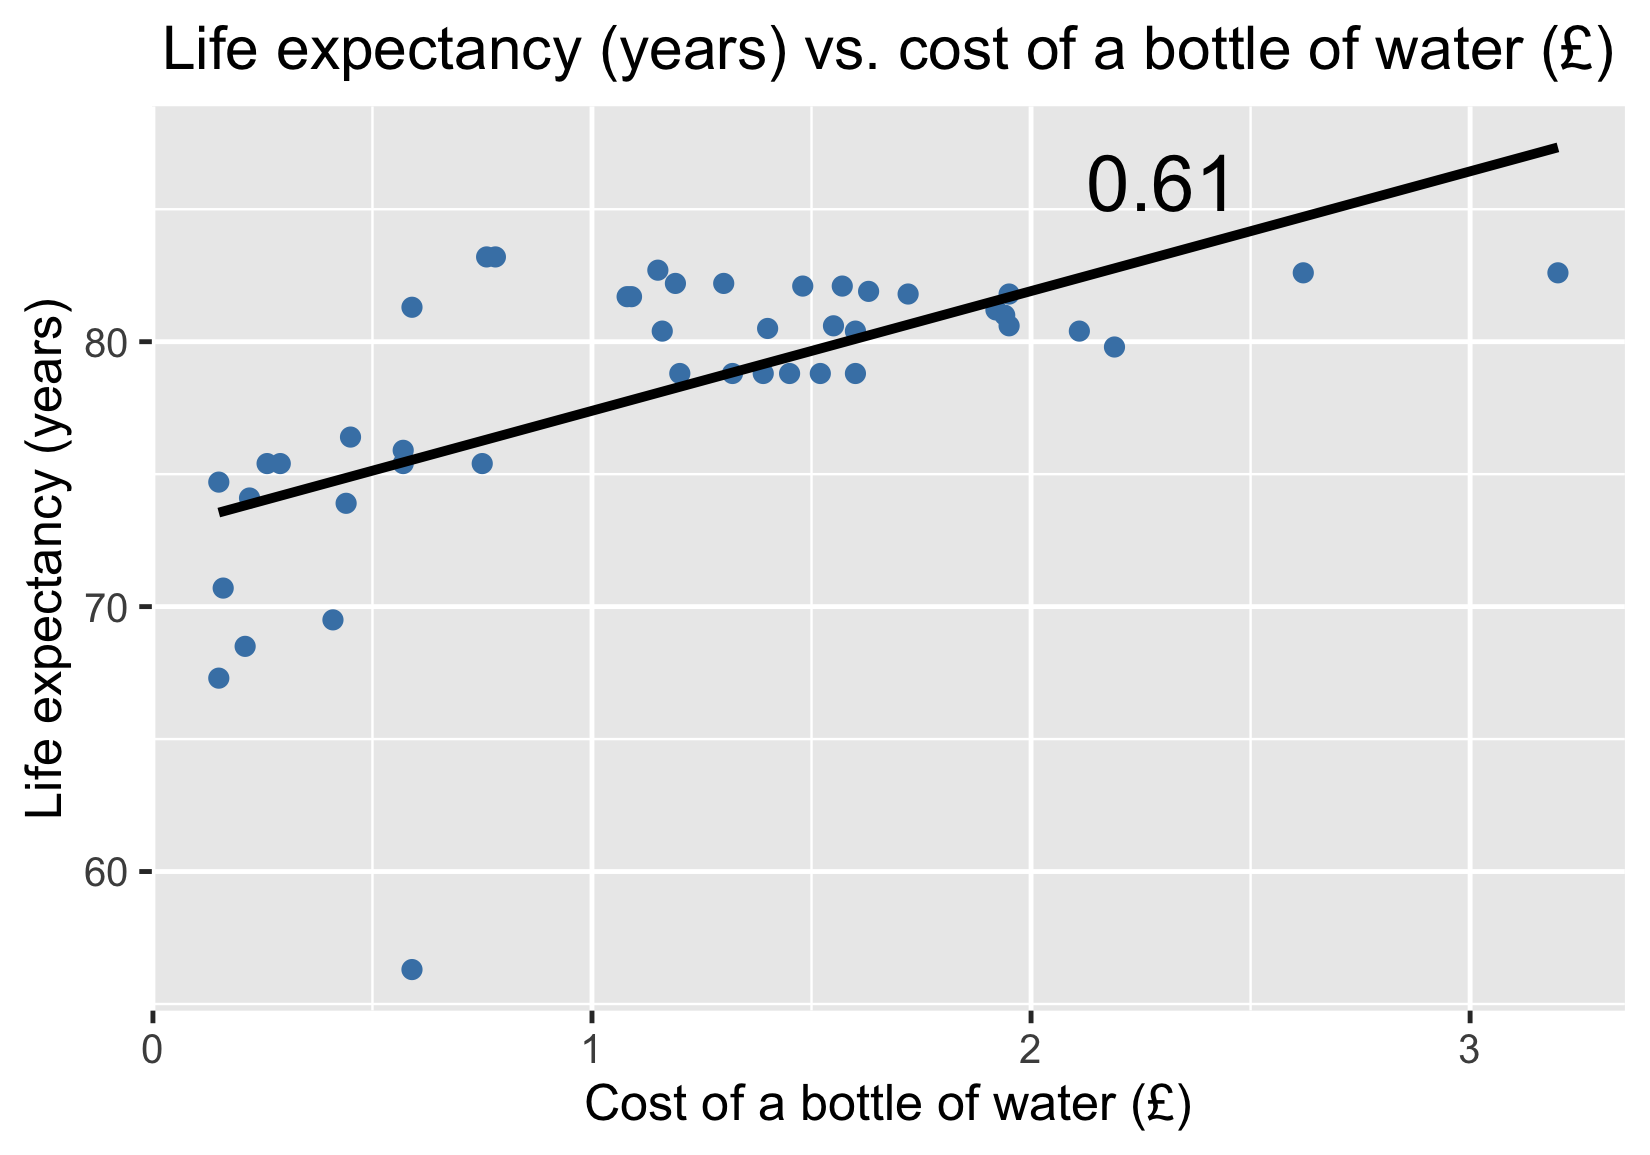
Correlation does not equal causation
- Will increasing the cost of water result in an increase in life expectancy?


- Correlation does not equal causation
1 Image credit: https://unsplash.com/@micheile; https://unsplash.com/@jon_chng
Confounding variables