Korrelation
Einführung in die Statistik

George Boorman
Curriculum Manager, DataCamp
Korrelation zwischen zwei Variablen
Lineare Korrelationen
- Linear = proportionale Veränderungen zwischen abhängigen und unabhängigen Variablen
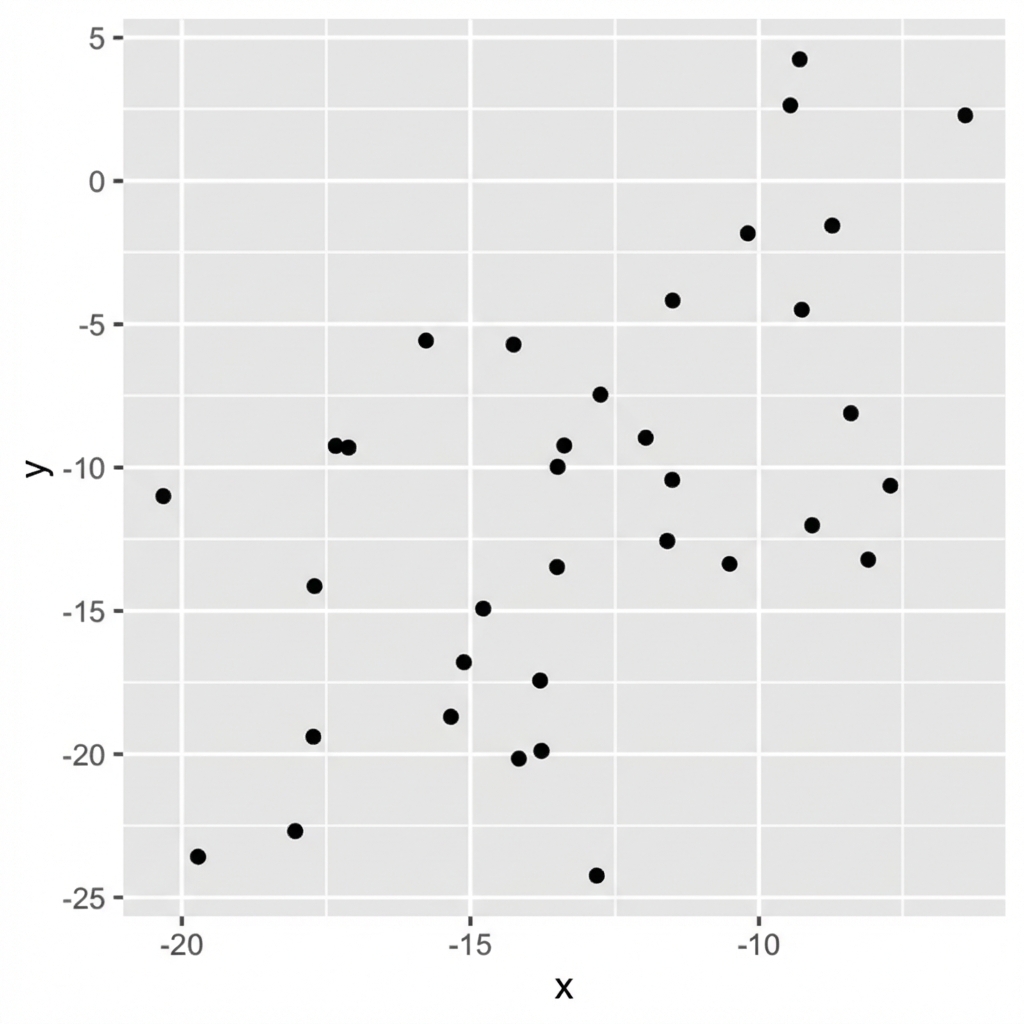
Werte = Stärke der Korrelation
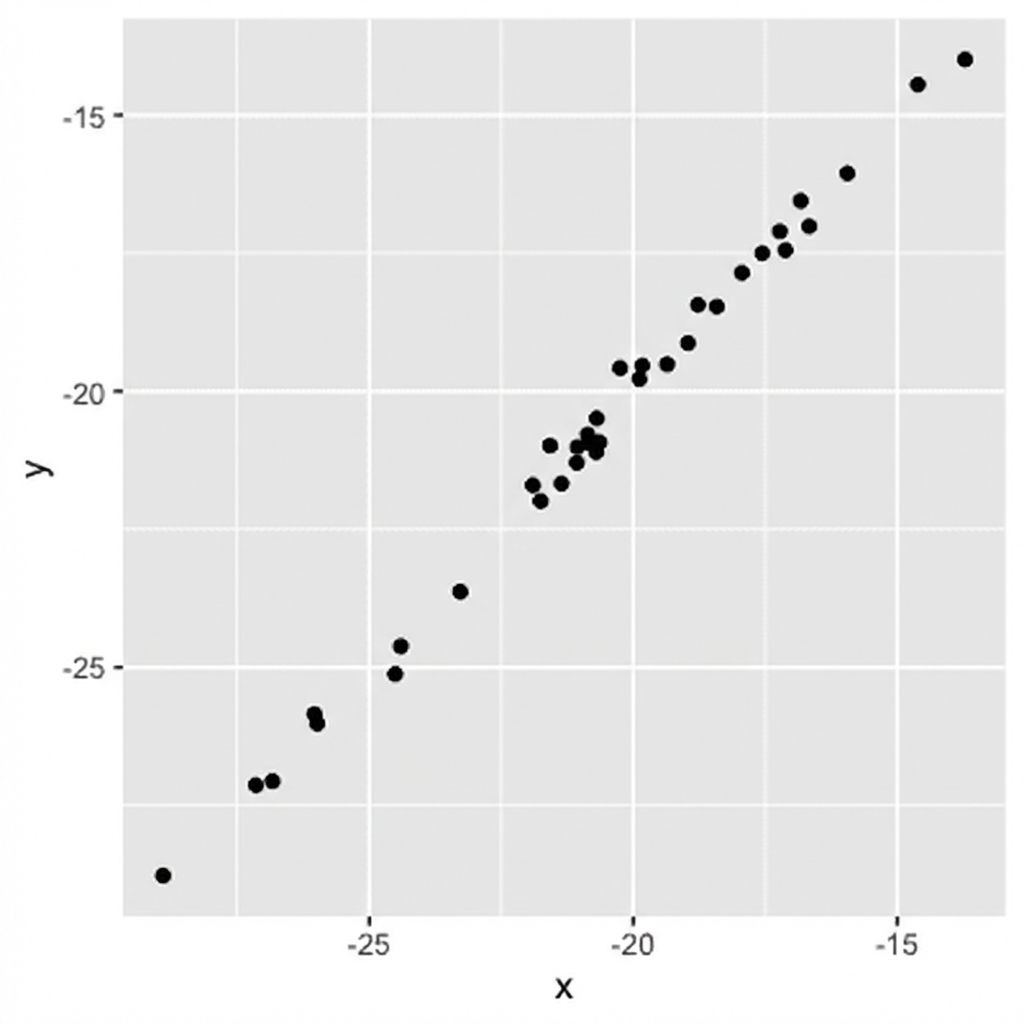
0,99 (sehr starke Korrelation)
Werte = Stärke der Korrelation
0,99 (sehr starke Korrelation)
0,75 (starke Korrelation)
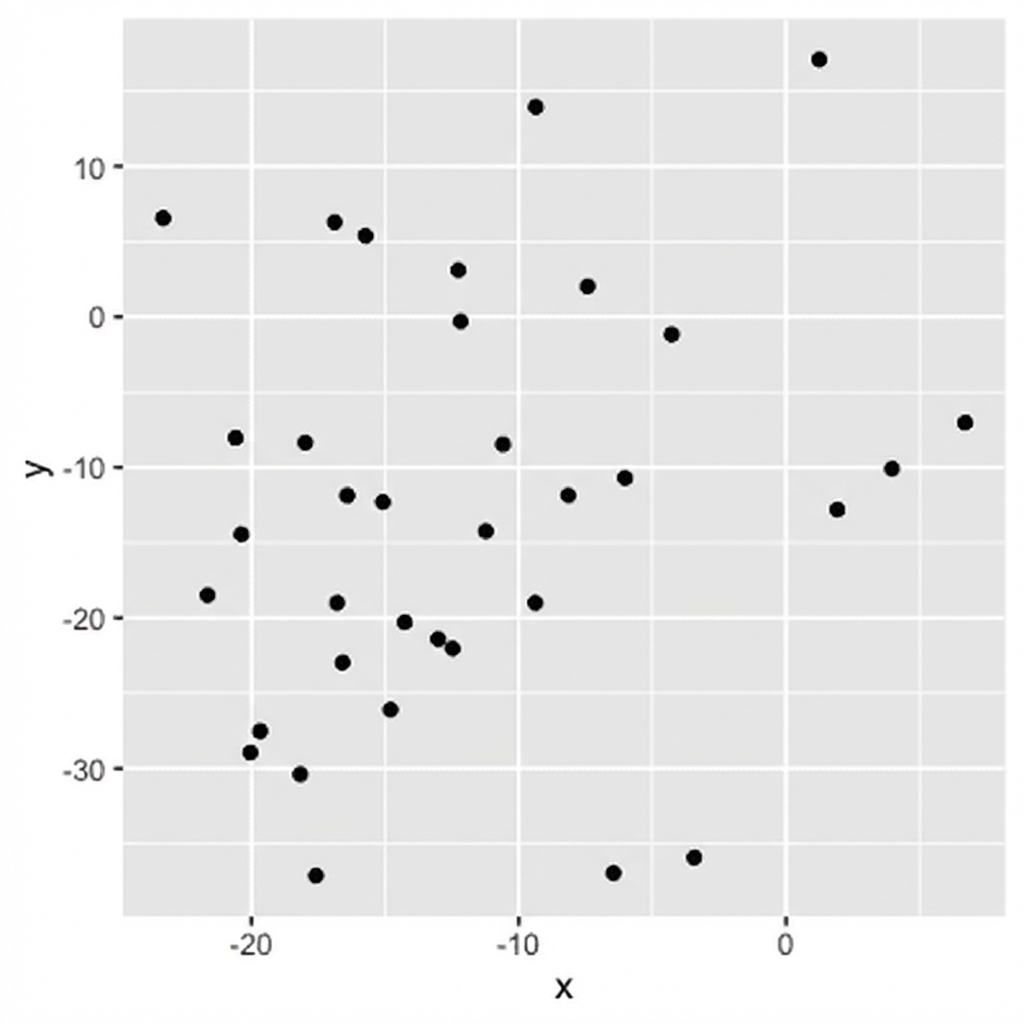
Werte = Stärke der Korrelation
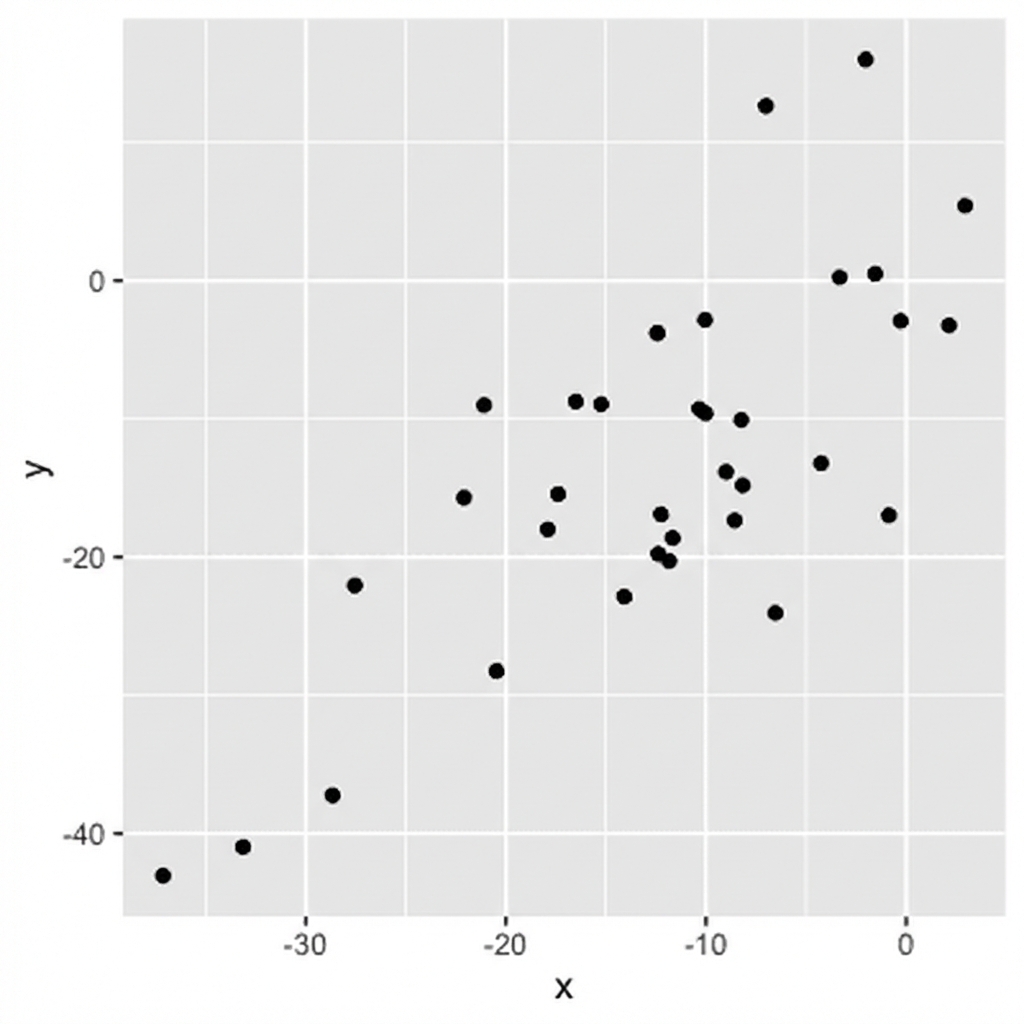
0,56 (moderate Beziehung)
Werte = Stärke der Korrelation
0,56 (moderate Beziehung)
0,21 (schwache Korrelation)
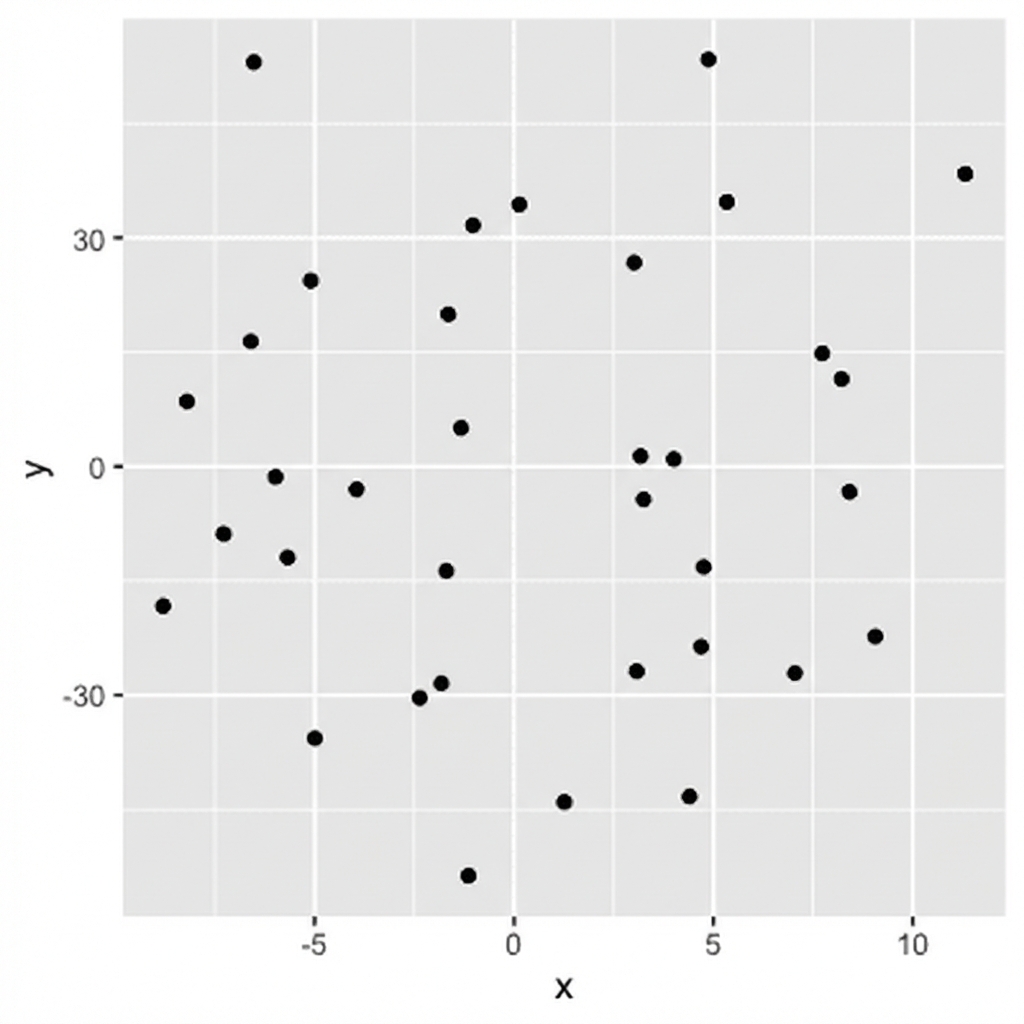
Werte = Stärke der Korrelation
0,04 (keine Korrelation)
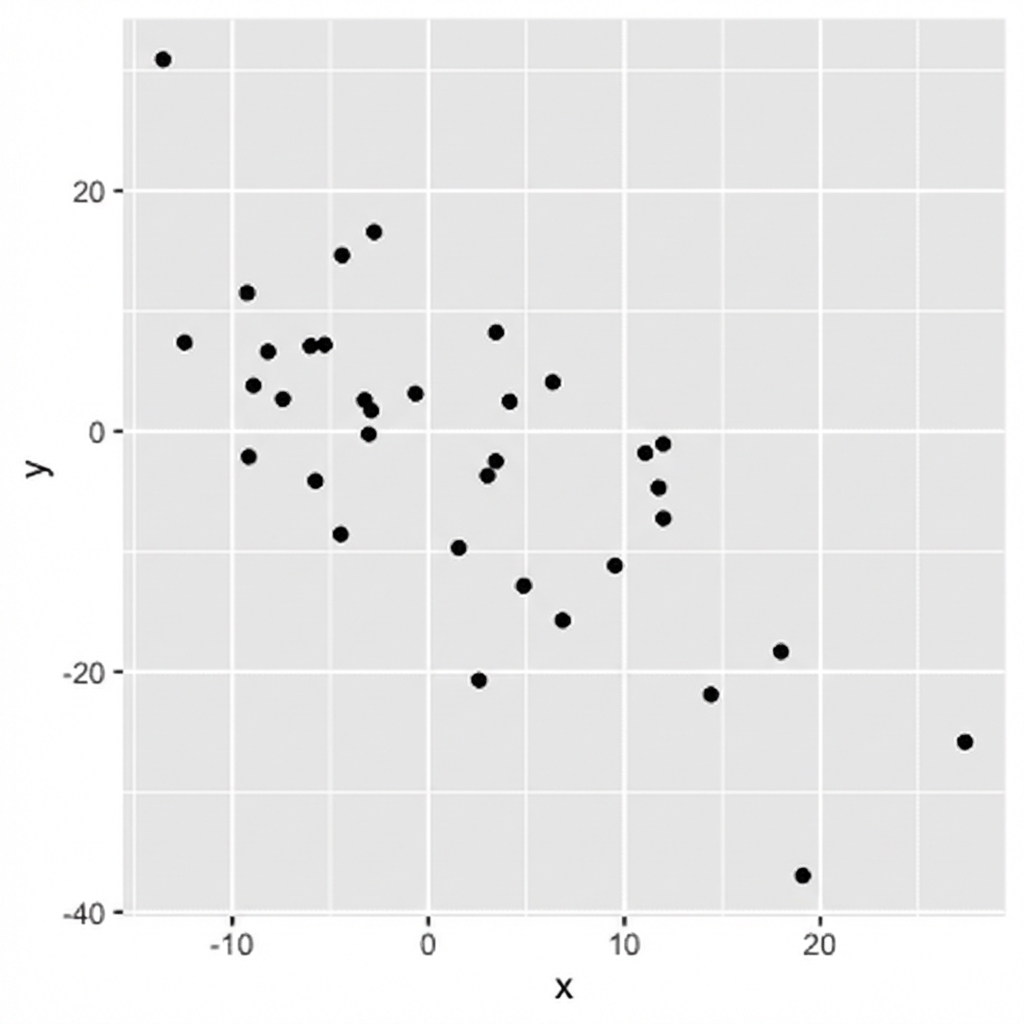
Vorzeichen = Richtung
0,75: Wenn x steigt, steigt y
-0,75: Wenn x steigt, sinkt y
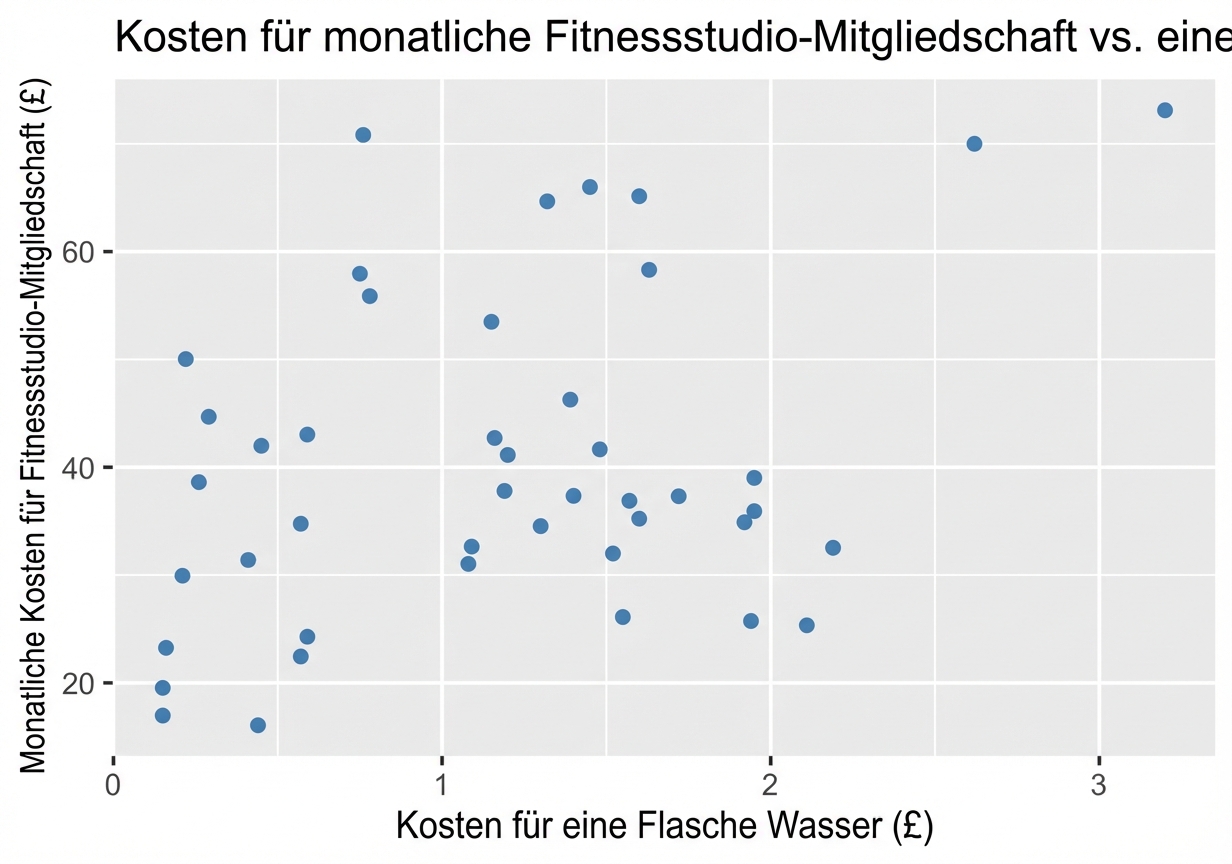
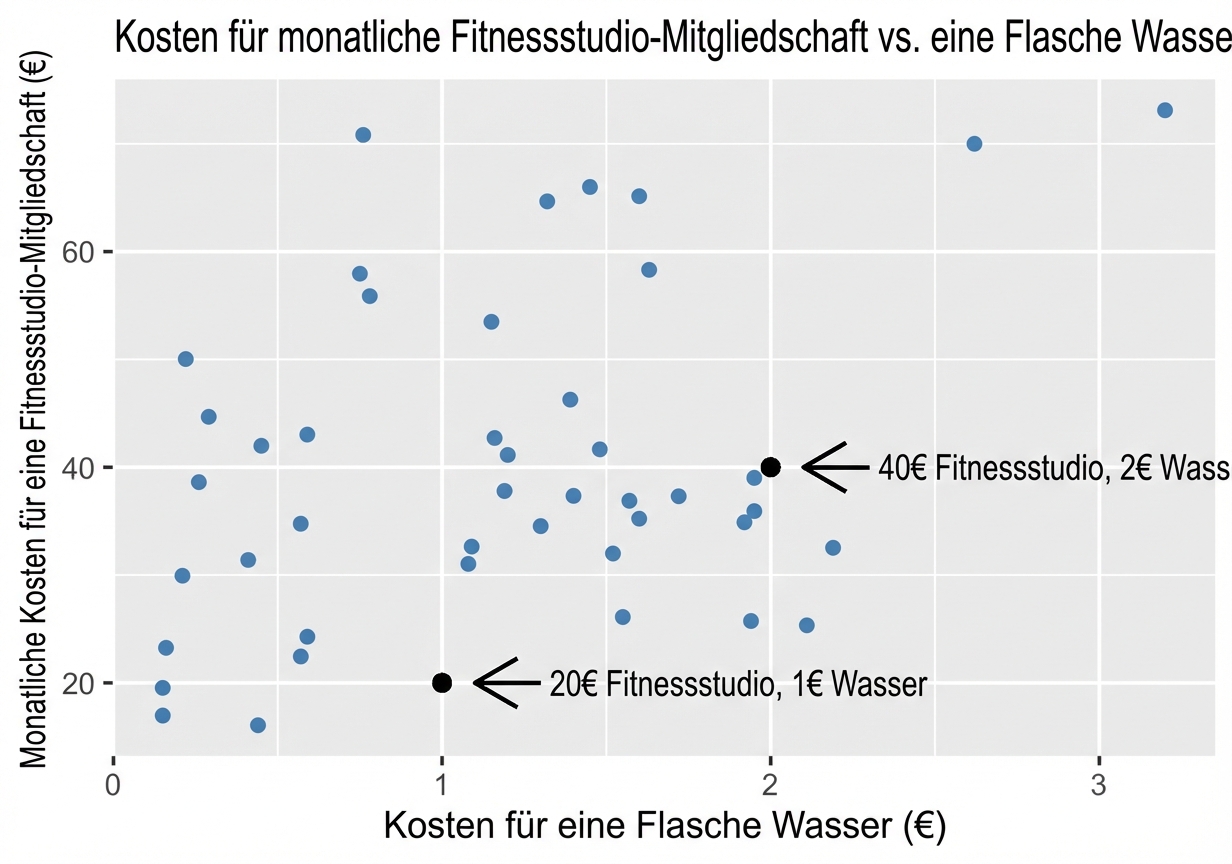
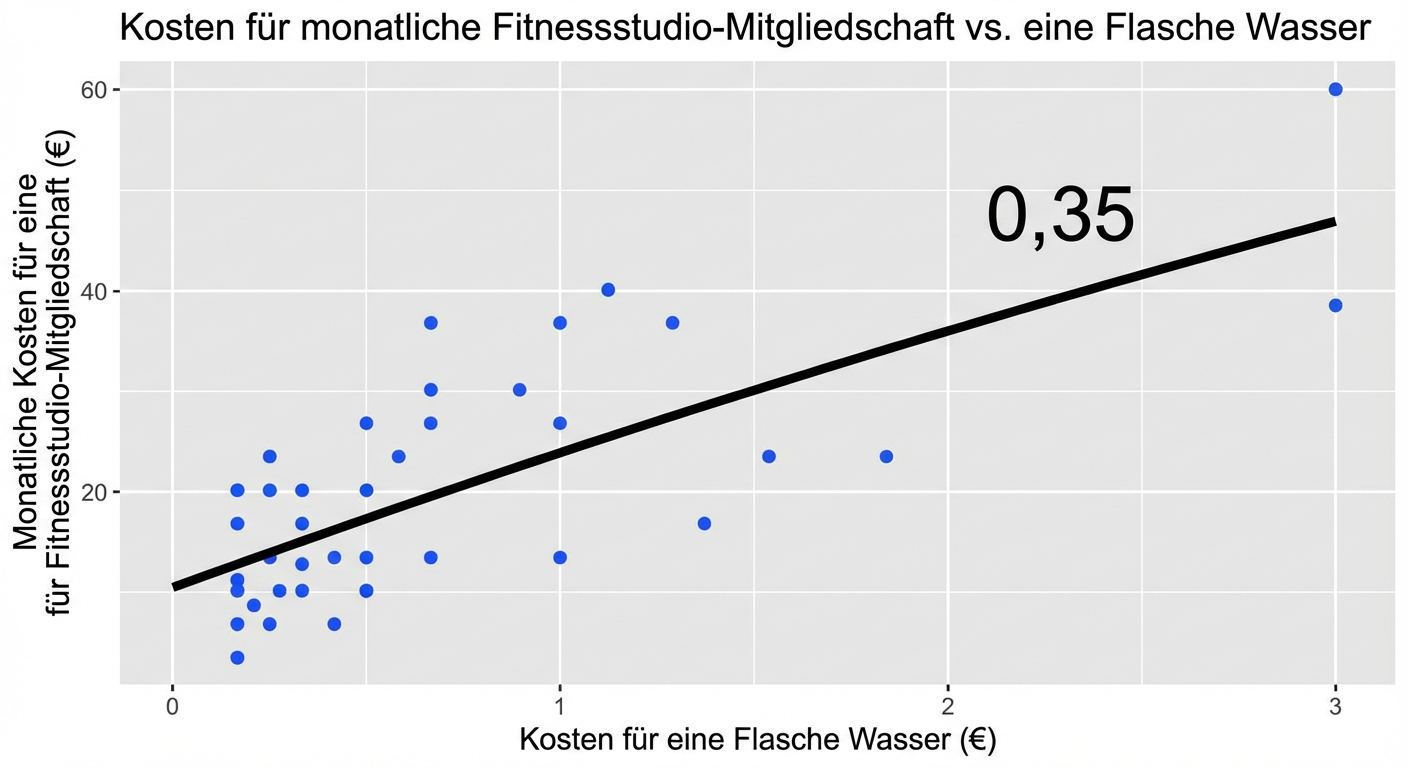
Fitnessstudiokosten vs. Wasserkosten
Hinzufügen einer Trendlinie
Lebenserwartung vs. Kosten für eine Flasche Wasser
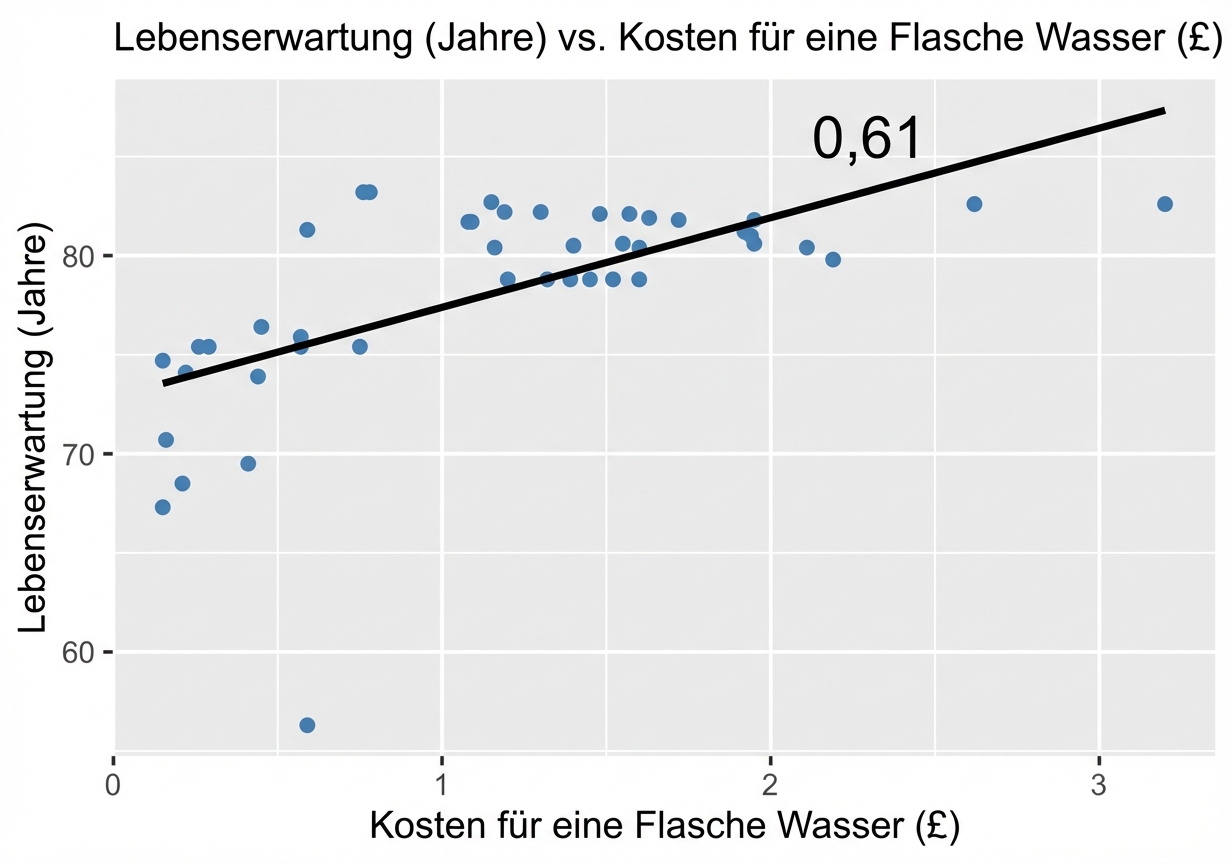
Korrelation ist nicht gleich Kausalität
- Führt eine Erhöhung der Wasserkosten zu einem Anstieg der Lebenserwartung?


- Korrelation ist nicht gleich Kausalität
1 Bildnachweis: https://unsplash.com/@micheile; https://unsplash.com/@jon_chng
Störvariablen