Visualization and prediction with Weibull model
Survival Analysis in Python

Shae Wang
Senior Data Scientist
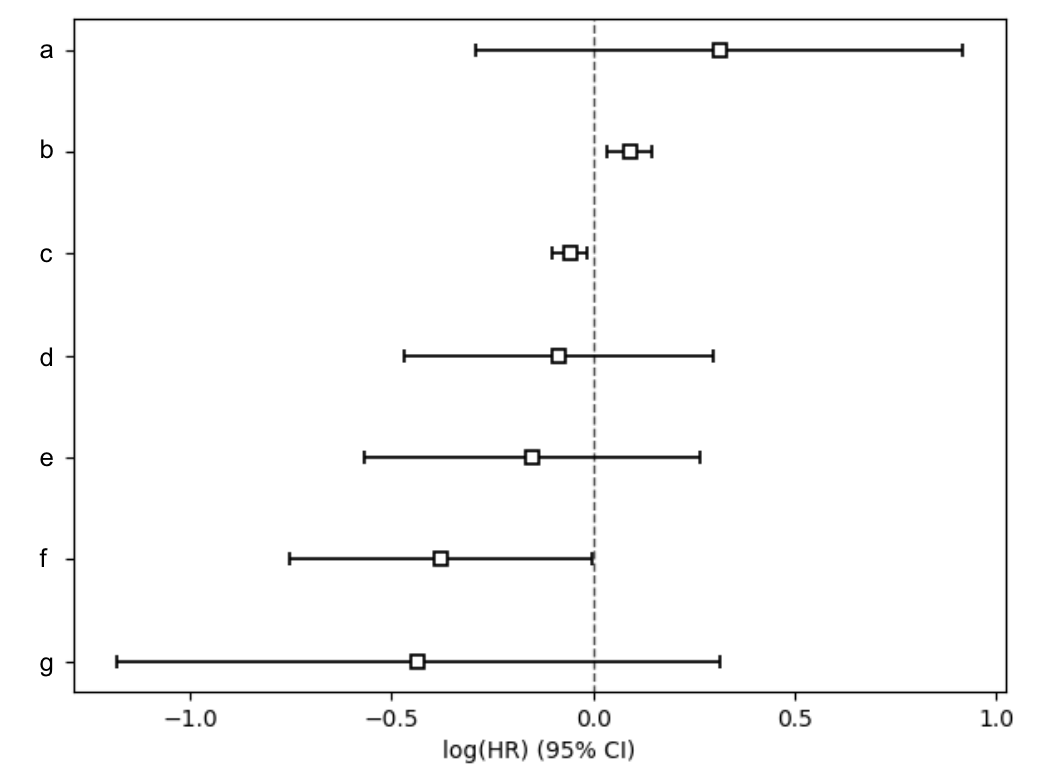
.plot()
Returns a plot of the coefficients and their ranges from the 95% confidence intervals.
aft.plot()
plt.show()
Sample plot:
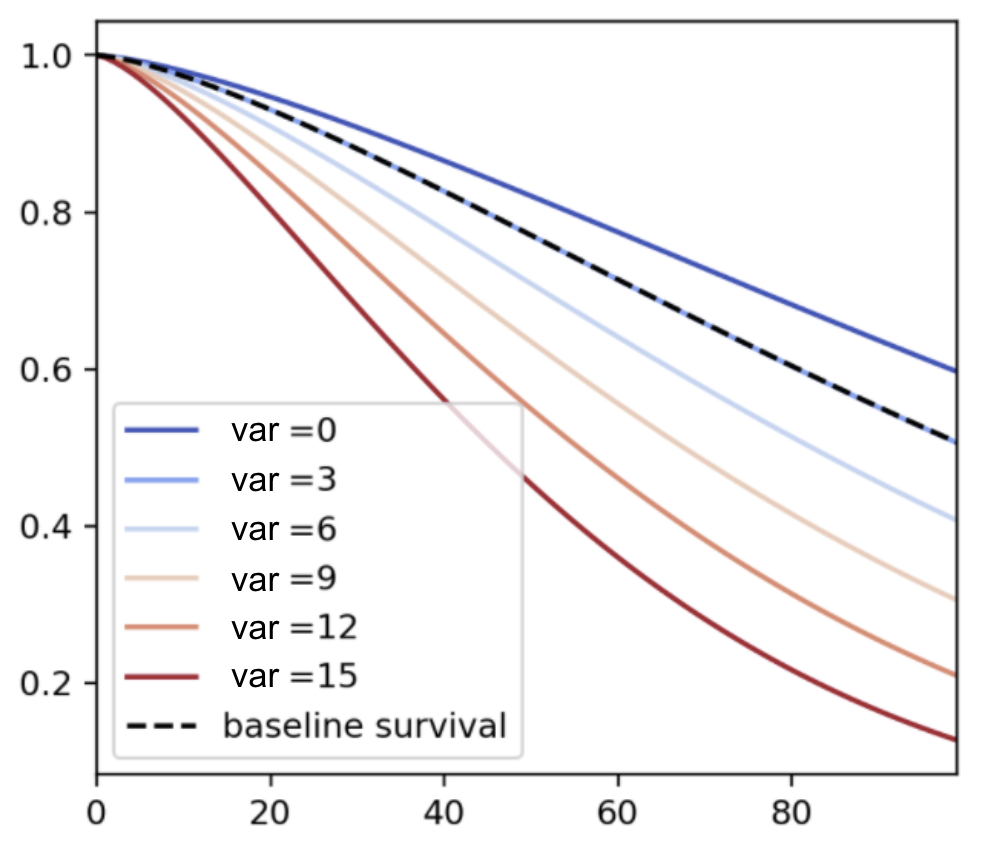
.plot_partial_effects_on_outcome()
Returns a plot comparing the baseline survival curve versus what happens when covariates are varied over values.
aft.plot_partial_effects_on_outcome(covariates, values)
plt.show()

How to plot partial effects?
aft.plot_partial_effects_on_outcome(
  covariates='var',
  values=[0, 3, 6, 9, 12, 15]
)
plt.show()
Mortgage example
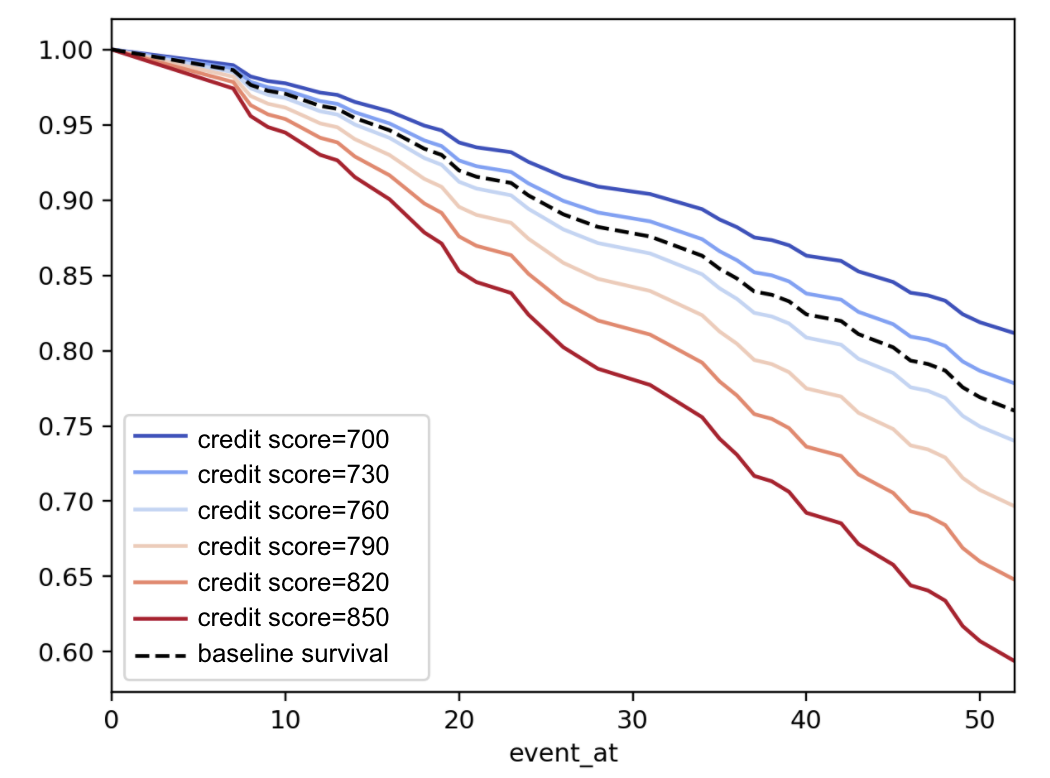
Predict survival functions
- Survival curves vary based on their covariates' values.


