Other distributions and model selection

Survival Analysis in Python

Shae Wang

Senior Data Scientist

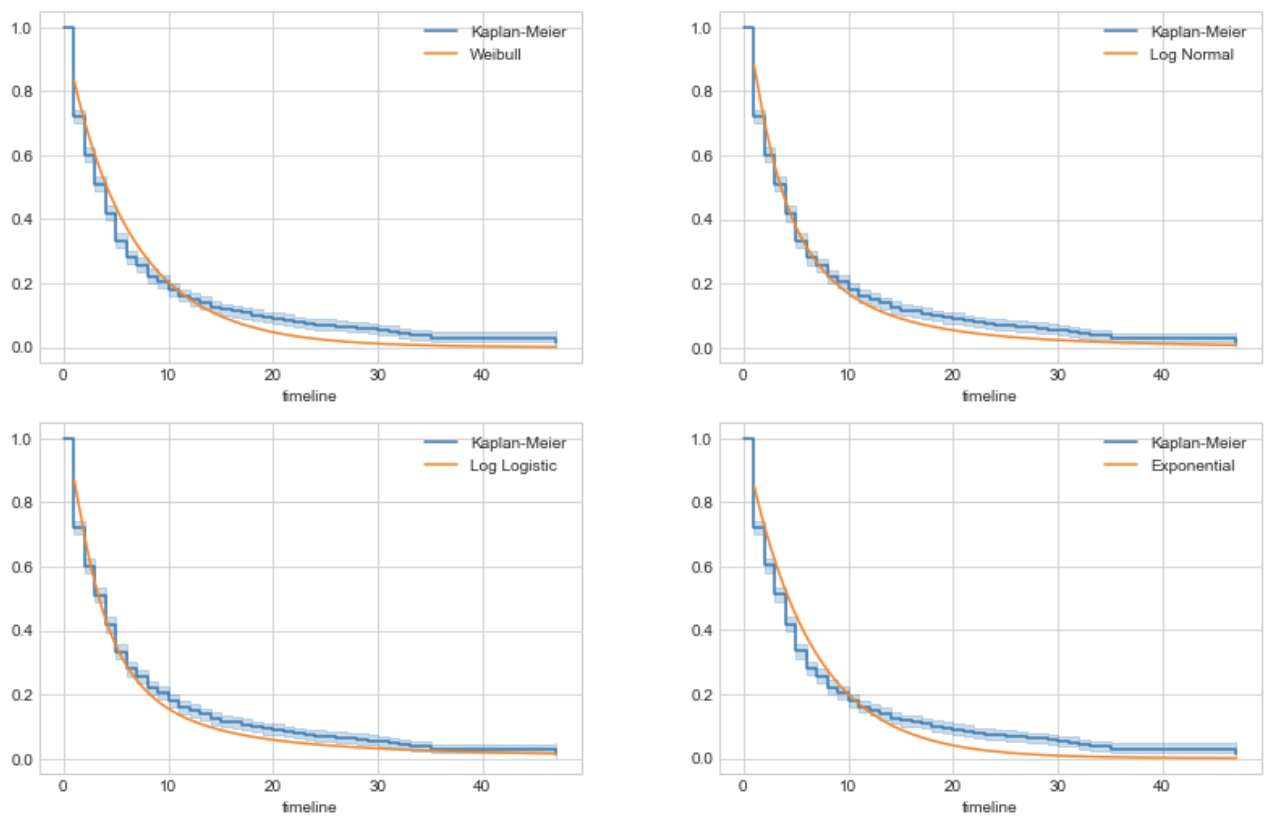
Which model fits the data the best?
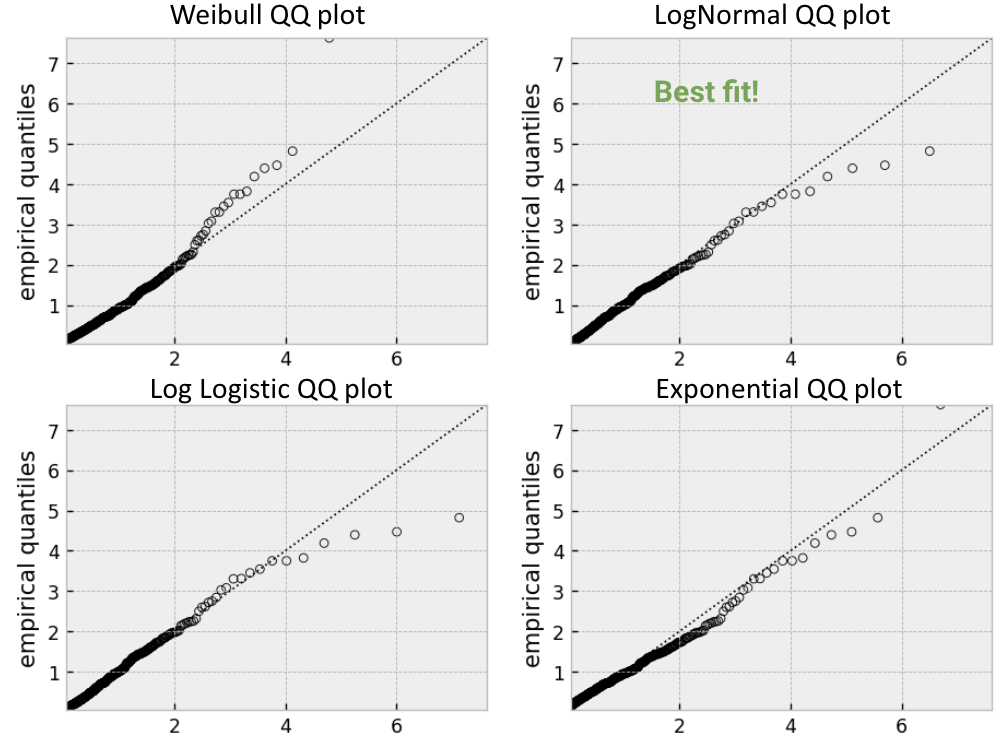
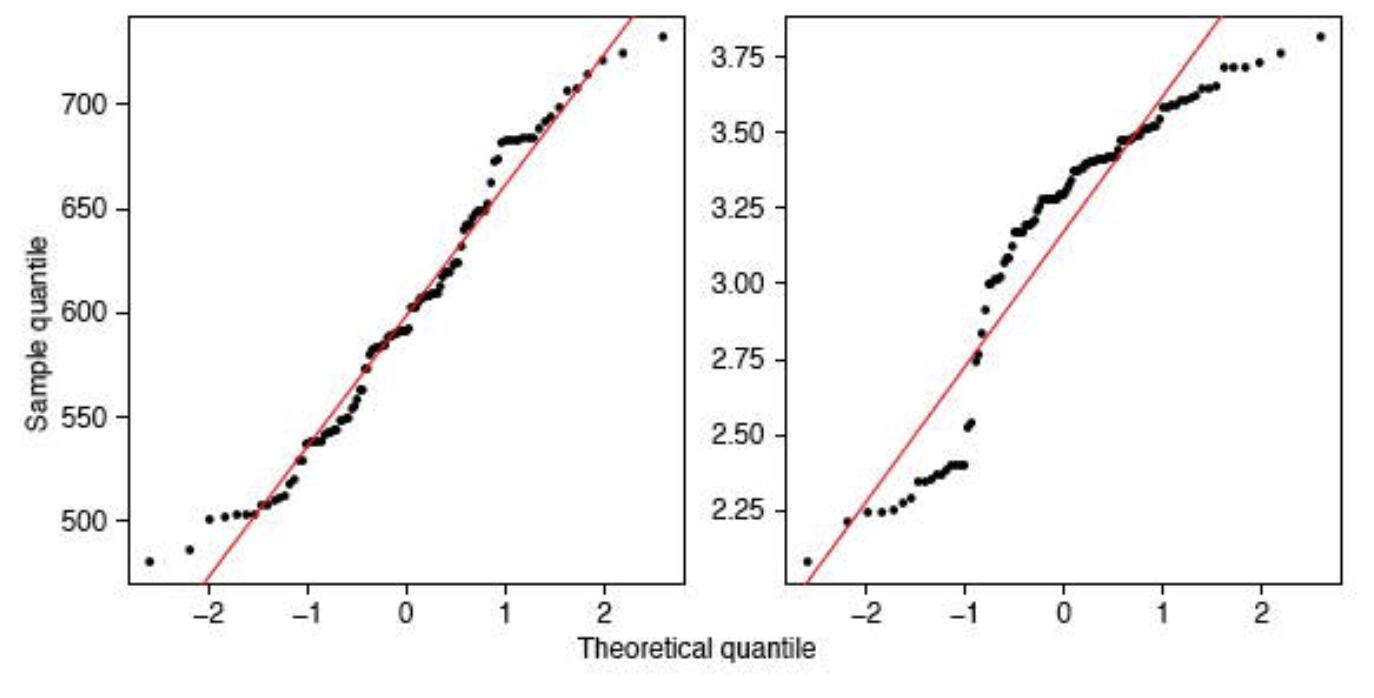
4 survival curves for the same data using different models

Survival Analysis in Python

Choosing parametric models

  • Non-parametric modeling (i.e. the Kaplan-Meier model)
    • Describes the data accurately because it's distribution-free
    • Is not smooth/continuous/differentiable
  • Parametric modeling (i.e. the Weibull model)
    • Parametric statistics will usually give us more information
    • When the wrong model is used, they lead to significantly biased conclusions
Survival Analysis in Python

Common parametric survival models

  • The Weibull model
    from lifelines import WeibullFitter
    
  • The Exponential model
    from lifelines import ExponentialFitter
    
  • The Log Normal model
    from lifelines import LogNormalFitter
    
  • The Log Logistic model
    from lifelines import LogLogisticFitter
    
  • The Gamma model
    from lifelines import GeneralizedGammaFitter
    
Survival Analysis in Python

The Akaike Information Criterion (AIC)

  • AIC: An estimator of prediction error and relative quality of statistical models for a given set of data.
  • Estimates the relative amount of information lost by a given model and penalizes large number of estimated parameters.
    • The less information a model loses, the higher the quality of that model.
    • The fewer parameters (less complex) a model is, the higher the quality of that model.
  • Given a set of candidate models for the data, the one with the minimum AIC value is the preferred model.
Survival Analysis in Python

Using the AIC for model selection

Step 1) Fit parametric models in lifelines

Step 2) Print and compare each model's AIC_ property

Step 3) The lowest AIC value is preferred

from lifelines import WeibullFitter, 
                      ExponentialFitter, 
                      LogNormalFitter
wb = WeibullFitter().fit(D, E)
exp = ExponentialFitter().fit(D, E)
log = LogNormalFitter().fit(D, E)
print(wb.AIC_, exp.AIC_, log.AIC_)
215.9091   216.1183   202.3498
Survival Analysis in Python

find_best_parametric_model()

  • find_best_parametric_model(): a built-in lifelines function to automate AIC comparisons between parametric models.
  • Iterates through each parametric model available in lifelines.

How to use it?

  • T: durations, E: censorship
    best_model, best_aic_ = find_best_parametric_model(event_times=T,
                                                       event_observed=E,
                                                       scoring_method="AIC")
    print(best_model)
    
<lifelines.WeibullFitter:"Weibull_estimate", 
fitted with 686 total observations, 387 right-censored observations>
Survival Analysis in Python

The QQ plot

  • QQ plot: Compares two probability distributions by plotting their quantiles against each other.
  • If the two distributions being compared are similar, the points in the QQ plot will approximately lie on the line y = x.

qq plot example

Survival Analysis in Python

Using QQ plots for model selection

Step 1) Fit parametric models in lifelines.

Step 2) Plot the QQ plot of each model.

Step 3) The QQ plot closest to y = x is preferred.

from lifelines.plotting import qq_plot

for model in [WeibullFitter(), LogNormalFitter(), LogLogisticFitter(), ExponentialFitter()]: model.fit(T, E) qq_plot(model)
plt.show()
Survival Analysis in Python

Using QQ plots for model selection

qq plot to compare

Survival Analysis in Python

Let's practice!

Survival Analysis in Python

Preparing Video For Download...