Interpreting the Cox PH model
Survival Analysis in Python

Shae Wang
Senior Data Scientist
The baseline hazards
- Hazard ratio: how much hazard increases or decreases relative to baseline hazards.
- Baseline hazards: the risk for individuals at the baseline levels of covariates.
- Baseline $\neq$ setting covariates to 0
- Baseline means setting covariates to their averages (median for
lifelines)
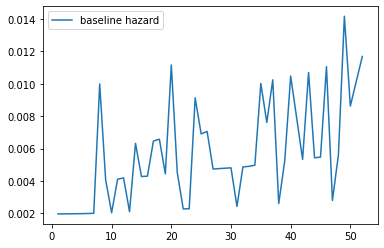
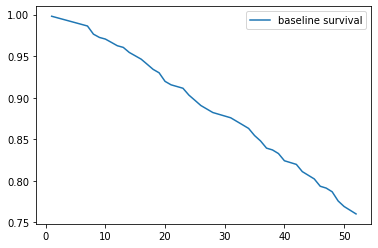
The baseline functions
Baseline hazard function
model.baseline_hazard_.plot()
plt.show()

Baseline survival function
model.baseline_survival_.plot()
plt.show()

Interpret the hazard ratio
- Hazard ratio: $e^{coef}$, how much hazard changes relative to the average individual when covariates change.
| Calculation | Example | |
|---|---|---|
| Coefficient | $x$ | $0.405$ |
| Hazard ratio | $e^x$ | $e^{0.405}=1.5$ |
| Hazards interpretation | $e^x-1$ | $1.5-1 = 0.5$ -> 50% increase in hazards |
| Survival time interpretation | $\frac{1}{e^x}-1$ | $\frac{1}{1.5}-1 = 0.67-1 = -0.23$ -> 23% decrease in survival time |
Visualize the hazard ratio
.plot_partial_effects_on_outcome()
covariates(string or list): name(s) of the covariate(s) in the original dataset that we wish to vary.- If there are multiple covariates, pass them in as a list.
values(1d or 2d iterable): values we wish the covariate to take on.- If there are multiple covariates, pass the values as pairs/tuples of values.
Visualize the hazard ratio
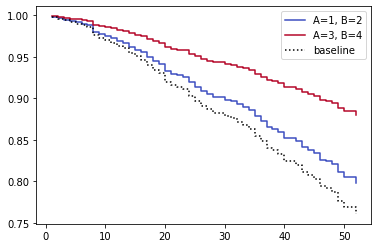
The model has covariates A, B, C, and we wish to vary
Aover 1, 2Bover 3, 4model.plot_partial_effects_on_outcome( covariates=["A","B"], values=[[1,2], [3,4]] ) plt.show()

Wrong...
Visualize the hazard ratio
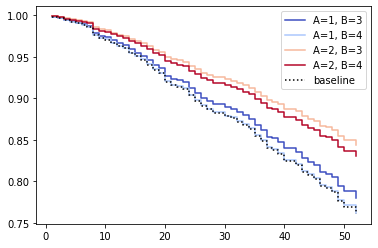
The model has covariates A, B, C, and we wish to vary
Aover 1, 2Bover 3, 4model.plot_partial_effects_on_outcome( covariates=["A","B"], values=[[1,3], [1,4], [2,3], [2,4]] ) plt.show()

Correct!
Let's practice!
Survival Analysis in Python

